Proven strategies to reduce credit consumption across all pricing models, monitor usage, and maximize your Data 360 (formerly Data Cloud) ROI
Reading time: ~18 minutes| Last Updated: March 2026
In This Guide
13
In-Depth Sections
Key Insight
53x
Batch vs Streaming Savings
In This Guide
5
FAQs Answered
Optimization
40%
Potential Credit Reduction
Salesforce Data 360 Credit Optimization — Complete Visual Guide
1
How Data 360 Credits Work
Quick Answer: Salesforce Data 360 (renamed from Data Cloud in October 2025) offers three pricing models: credit-based consumption, profile-based SKUs ($240-$420 per 1,000 profiles), and flex credits. For the credit model, Credits = (Rows Processed / 1,000,000) x Multiplier, with different multipliers per operation type. Credits are fungible across all features.
Salesforce rebranded Data Cloud to Data 360 in October 2025, repositioning it from a customer data platform to an enterprise-wide data foundation. According to Futurum Group's analysis, Salesforce then announced a comprehensive pricing overhaul effective March 2, 2026, introducing three distinct pricing models to address long-standing complaints about cost unpredictability.
Data 360 Credit Consumption Model - Every data operation in Salesforce Data 360 consumes credits from a fungible pool, with costs determined by operation-specific multipliers.
Unlike traditional per-seat Salesforce licensing, Data 360 operates on a consumption-based model where you pay based on actual data processing volume. According to the official Salesforce Data 360 pricing page, every action you perform generates a usage event that consumes credits at a rate determined by a multiplier specific to that operation type. The per-operation credit multipliers remain fully documented and active for customers using the credit-based model.
The Credit Consumption Formula
The fundamental formula driving all Data 360 billing is straightforward:
Formula
Credits Consumed = (Data Volume / 1,000,000) x Multiplier

Example: Batch Calculated Insight on 2M rows
= (2,000,000 / 1,000,000) x 15
= 2 x 15
= 30 credits
As documented on the Trailhead credit consumption module, credits are consumed again every time an operation refreshes, edits, or reschedules. A calculated insight that refreshes daily on 2 million rows consumes 30 credits per day, or roughly 900 credits per month, just for that single insight.
Credit-Based Consumption: A single, fungible credit pool (Data Services Credits) used across all Data 360 operations. Previously split into separate credit types, these were consolidated into one pool in mid-2025. Per-operation multipliers still apply. This is the model detailed in this guide.
Profile-Based SKUs (New): Fixed pricing at $240 per 1,000 profiles (baseline) or $420 per 1,000 profiles (premium) annually. Provides predictable budgeting tied to customer profile count rather than data processing volume.
Flex Credits (New): Fungible credits poolable across Data 360, Agentforce, Slack, and other Salesforce services. Enables dynamic allocation based on evolving business priorities without pre-committing to specific products.
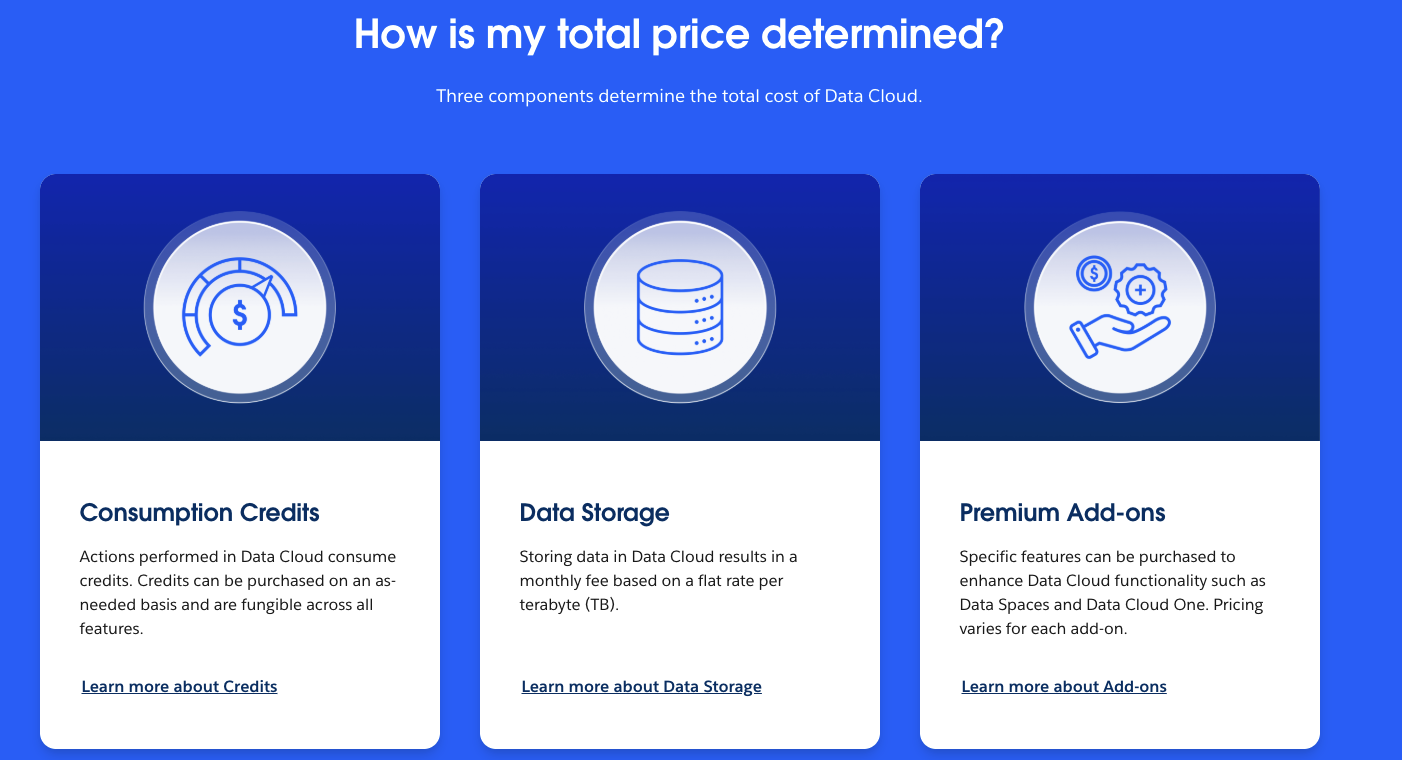
Additionally, data storage is billed separately per terabyte per month, and premium add-ons (Data Spaces, Data 360 One, Real-Time Profiles, Ad Audiences) carry additional fixed costs.
Three Components of Data 360 Pricing - Consumption Credits (fungible across all features), Data Storage (flat rate per TB), and Premium Add-ons (Data Spaces, Data 360 One) determine total cost.
Source: Salesforce Data 360 Pricing
Estimate Your Data 360 Costs
Use Salesforce's official pricing calculator to model your expected credit consumption across all three pricing models before you build.
This Guide Focuses On: The credit-based consumption model, which remains the most common model for existing Data 360 customers. The per-operation multipliers documented here are still active on Salesforce's pricing page. If you're on profile-based SKUs, some operations may be unmetered, but the optimization principles still apply to overall platform efficiency.
Free Ingestion: As of mid-2025, ingesting structured data from Salesforce applications (Sales Cloud, Service Cloud, Marketing Cloud Engagement, Marketing Cloud Personalization, and Commerce Cloud) using native connectors is free (0 credits). This removed the "paying twice for your own data" complaint. See the Salesforce Help article for details.
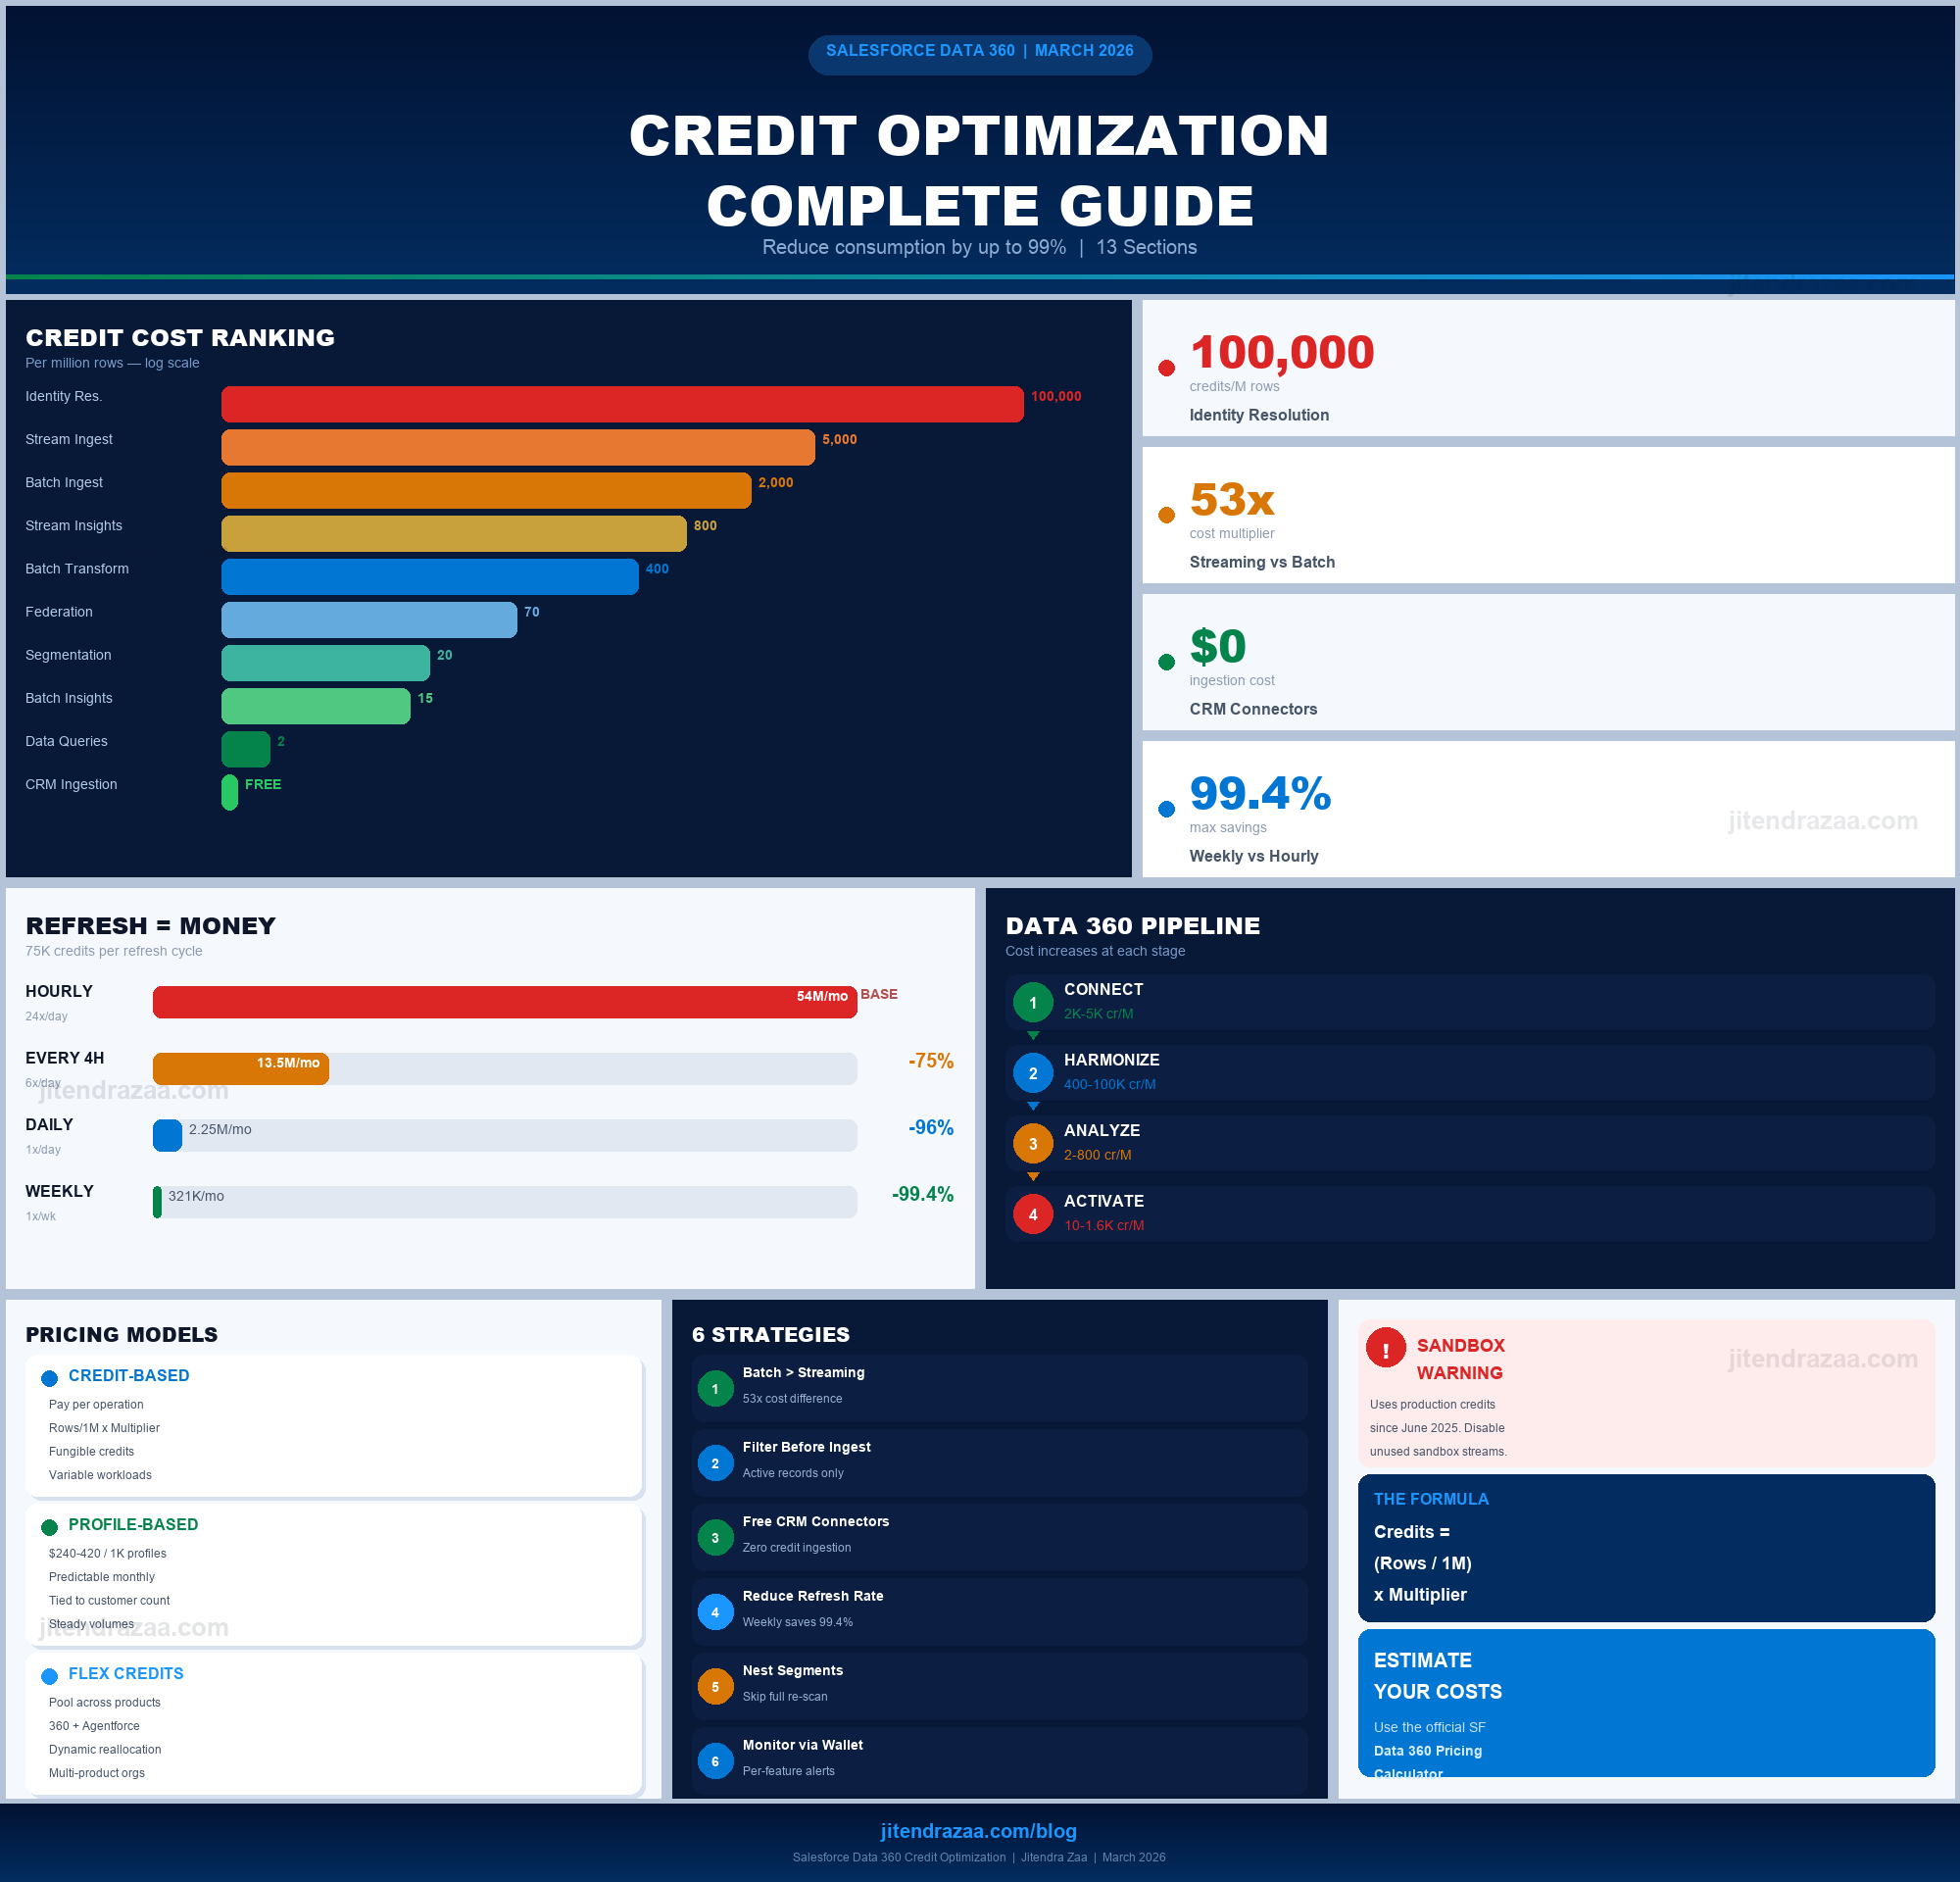
Credit Consumption Categories
The Trailhead module organizes credit consumption into six categories that map to the Data 360 pipeline:
Data 360 Credit Pipeline — Cost Increases Left to Right
1
Connect
Ingest batch & streaming data
2K – 5K credits/M rows
Batch Ingestion: 2,000
Streaming Ingestion: 5,000
CRM Ingestion: FREE
2
Harmonize
Transform, map & unify profiles
400 – 100K credits/M rows
Transforms: 400 – 5,000
Identity Resolution: 100,000
Federation: 70
3
Analyze
Insights, inferences & queries
2 – 800 credits/M rows
Batch Insights: 15
Streaming Insights: 800
Data Queries: 2
4
Activate
Segment, activate & share
10 – 1,600 credits/M rows
Segmentation: 20
Batch Activation: 10
Streaming Activation: 1,600
Hidden Cost: Features can consume credits from more than one usage type. For example, previewing a data transform consumes credits from the Data Queries usage type, not just Batch Data Transforms. Always check the billing considerations documentation for each feature.
2
Complete Credit Rate Card
The following table compiles the official credit multipliers from the Salesforce Data 360 pricing page and the Data 360 Platform Services Rate Sheet. These rates apply to the credit-based consumption model in production environments; sandbox environments consume at a 20% discount. Customers on profile-based SKUs have different cost structures.
Operation
Unit
Batch Multiplier
Streaming Multiplier
Cost Level
Internal Data Pipeline (SF CRM)
Per 1M Rows
0 (Free)
0 (Free)
Free
External Data Pipeline
Per 1M Rows
2,000
5,000
Medium
Data Transforms
Per 1M Rows
400
5,000
Medium
Calculated Insights
Per 1M Rows
15
800
Low-High
Profile Unification (Identity Resolution)
Per 1M Rows
100,000
100,000
Very High
Segmentation
Per 1M Rows
20
20
Low
Batch Activation
Per 1M Rows
10
-
Low
Streaming Activation (DMO)
Per 1M Inferences
-
1,600
High
Data Queries
Per 1M Rows
2
-
Low
Data Federation / Sharing
Per 1M Rows
70
70
Medium
Streaming Actions (Lookups)
Per 1M Rows
-
800
High
Unstructured Data
Per 1 MB
60
60
Medium
Real-Time Profile & API
Per 1M Rows
-
900
High
Critical Insight: Identity Resolution is 50x more expensive than external data ingestion and 6,667x more expensive than calculated insights (batch). A single Identity Resolution run on 10 million source profiles consumes 1,000,000 credits. This is typically the single largest credit consumer in any Data 360 implementation.
3
The 5 Costliest Mistakes That Drain Credits
Based on documented implementation experiences and Trailblazer Community discussions, these are the five most expensive mistakes organizations make with Data 360 credits.
1Ingesting All Data "Just in Case"
Impact: Can double initial credit spend
The temptation to bring in all historical data before defining use cases is the most common and expensive mistake. Once data is ingested and classified as Engagement, Profile, or Other, this classification becomes locked and cannot be changed. If teams later discover data needs re-modeling, they must re-ingest and re-transform everything at full credit cost.
Fix: Define specific high-impact use cases and activation strategies before ingesting any data. Only bring in data that directly supports documented business requirements.
2Overloading Ingestion with Unnecessary Fields
Impact: 10%+ wasted credits on storage and processing
Ingesting entire datasets with all available fields and planning to "clean it up later" through transforms. Unfiltered ingestion forces the system to store, process, and transform data that will never be used. Implementations have found over 10% of ingested records contain null values in critical fields yet are still processed at full cost.
Fix: Implement upstream filtering before data enters Data 360. For email marketing activation, filter out records with null email addresses before ingestion, not after. Organizations report 10-30% credit savings from field-level filtering alone.
Many teams assume Identity Resolution runs once daily in a batch. In reality, IR operates in auto-mode where rules run incrementally throughout the day as new data arrives. Adding 10,000 new records might impact 20,000-30,000 existing unified profiles because IR re-evaluates existing profiles against new information.
Fix: Align downstream processing schedules (calculated insights, segments) with IR's actual incremental behavior. Monitor how new ingestions impact existing profile counts holistically across the pipeline.
4Running Unfiltered Exploratory Queries
Impact: Thousands of credits per single query
While queries cost only 2 credits per million rows, a single unfiltered query against a 100-million-record Audience DMO without a WHERE clause could consume 200 credits in one execution. Multiply this across dozens of analysts running exploratory queries during implementation, and the costs accumulate rapidly.
Fix: Always use WHERE clauses, implement LIMIT statements, preview on sample data first, and establish review processes for exploratory queries on large DMOs.
5Poor Data Model Design Requiring Complex Joins
Impact: 20-40% higher segmentation and activation costs
Simply lifting and shifting your Salesforce data model into Data 360 creates complex traverse paths that require processing multiple linked DMOs during every activation run. If your activation only needs Unified Individual ID and Product Name but they reside in separate DMOs requiring traversal through Account, Opportunity, and Order objects, all intermediate objects are processed on every run.
Fix: Design your data model specifically for Data 360 consumption patterns. Group related fields that will be accessed together into the same DMO to reduce join complexity. Organizations that invest in proper field mapping report 20-40% reductions in segmentation and activation costs.
4
Identity Resolution: The Most Expensive Operation
Profile Unification consumes 100,000 credits per million rows processed in both batch and streaming modes, according to the Salesforce Data 360 pricing page. This makes it the single most expensive operation in Data 360, reflecting the computational complexity of matching records across heterogeneous data sources.
Understanding the True Cost
The credit impact of Identity Resolution goes beyond the initial run. As explained in the Trailhead credit consumption module, IR doesn't just process new records; it re-evaluates existing profiles against new information.
Initial Unification Cost
250K credits
Organization ingesting 2.5M records from 3 sources (Salesforce CRM, data warehouse, third-party). At 100,000 credits per million rows = 250,000 credits for initial unification alone.
Ongoing Daily Cost
Varies daily
IR runs incrementally throughout the day in auto-mode, not as a single daily batch. Daily data updates trigger re-evaluation of existing profiles, expanding total rows processed far beyond the new ingestion volume.
Strategies to Reduce Identity Resolution Costs
Filter Upstream Before Ingestion
Only bring in customer records from the last 12–24 months rather than complete historical records. This directly reduces the dataset IR must process.
High Impact
Refine Match Rules for Precision
Overly broad matching criteria unify unrelated records and increase processing burden. Use precise match methods (exact email, exact phone) before fuzzy matching.
Quick Win
Monitor Profile Count Growth
Track how new ingestions impact existing unified profile counts. Unexpected growth indicates match rules may be too broad or data quality issues are creating duplicate profiles.
Ongoing
Use Digital Wallet Feature-Level Tracking
Monitor IR credit consumption specifically via the Digital Wallet to understand how your unification decisions impact overall spending.
Visibility
5
Batch vs Streaming: The Cost-Latency Tradeoff
The choice between batch and streaming processing is the single largest cost lever in Data 360. According to the official rate card, streaming can cost up to 53x more than batch for certain operations.
Cost Comparison by Operation Type
Operation
Batch (per 1M rows)
Streaming (per 1M rows)
Streaming Premium
External Data Pipeline
2,000
5,000
2.5x
Data Transforms
400
5,000
12.5x
Calculated Insights
15
800
53x
Activation
10
1,600
160x
Real-World Impact: Processing 1 billion records annually through calculated insights: Batch = 15,000 credits. Streaming = 800,000 credits. That is a difference of 785,000 credits for the same analytical output, differentiated only by latency. Default to batch unless sub-15-minute latency is genuinely required.
In-session ecommerce personalization (recommendations expire in minutes)
Customer service routing that must react to live behavior
Real-time offer personalization during checkout
Batch Is Better For
Daily email campaigns (sent next morning anyway)
Weekly reporting and dashboards
Monthly segment refreshes for nurture campaigns
Data quality analysis and enrichment
Decision Rule: Only use streaming for operations where the business value degrades within 15 minutes. If the output isn't consumed until the next day (e.g., daily email campaigns), batch processing at 1/53rd the cost delivers identical business results.
6
Data Ingestion Optimization
Data ingestion is where the credit burn begins. According to the Salesforce billing considerations for data ingestion, external batch ingestion costs 2,000 credits per million rows, while streaming costs 5,000 credits per million rows.
Data federation (querying external data without ingestion) costs 70 credits per million rows accessed per the billing considerations for data federation. While this appears cheaper than ingesting data, running frequent queries against the same external dataset can quickly exceed the one-time cost of ingestion.
Federation vs Ingestion Decision: If you access the same external dataset more than ~29 times (70 credits x 29 = 2,030 credits, exceeding the 2,000-credit one-time batch ingestion cost), it becomes cheaper to ingest the data once and store it. Analyze your actual access patterns before committing to a federation architecture.
Ingestion Best Practices
Filter Records at the Source
Only ingest active customers from the last 12–24 months. Remove records with null values in critical fields (email, phone) before ingestion.
High Impact
Select Only Needed Fields
Avoid ingesting all available columns. Map your activation use cases to specific fields and only bring in what is required.
Quick Win
Prefer Batch Over Streaming
Streaming ingestion costs 2.5x more (5,000 vs 2,000 credits per million rows). Use batch unless real-time data freshness is a hard requirement.
2.5x Savings
Leverage Free Salesforce Connectors
Maximize use of native CRM, Marketing Cloud, and Commerce Cloud connectors which cost zero credits for ingestion.
Zero Cost
7
Segmentation & Activation Cost Control
Per the billing considerations for segmentation, segment processing costs 20 credits per million rows processed. Batch activation adds 10 credits per million rows. These rates seem low, but the true cost depends on the total rows scanned, not just qualifying records.
The Hidden Cost of Segmentation
A segment selecting customers with lifetime value over $10,000 from a 50-million-record base must process all 50 million rows to find matches, consuming 1,000 credits even if only 5 million qualify. Complex segments requiring joins across multiple DMOs multiply this further because each object in the traverse path is scanned.
Audit segments regularly. Inactive segments on scheduled refreshes continue consuming credits. Remove or pause segments no longer providing business value.
Immediate
Nest Common Filters
Create a base segment (e.g., "High-Value Active Customers") and build sub-segments that filter from it. This avoids reprocessing the full population for each variation.
Architecture
Reduce Segment Refresh Frequency
A daily segment processing 50M rows at 20 credits/M = 1,000 credits/day (30,000/month). Switching to weekly refresh saves ~25,700 credits/month with acceptable freshness for most campaigns.
~86% Savings
Minimize Activation Destinations
Each destination activation incurs separate costs. A 5M-record segment activated to 3 destinations = 3 separate activation runs. Consolidate where possible.
3x Multiplier
Limit Related Attributes in Activations
Adding enrichment attributes to activations increases the data traversed. Only include attributes the destination system actually uses for personalization.
Lean Data
Pro Tip: Streaming activation costs 160x more than batch activation (1,600 vs 10 credits per million rows). Reserve streaming activation exclusively for real-time use cases like in-session personalization or fraud prevention.
8
Data Model Design for Cost Efficiency
Your Data 360 data model directly impacts credit consumption during segmentation and activation. Organizations that invest in proper data model design report 20-40% reductions in segmentation and activation costs compared to those that simply replicate existing CRM data structures.
The Join Complexity Problem
When activation runs against a data path spanning 4-6 linked DMOs, each object in the traverse path is scanned and processed on every activation run. Even if you only need the Unified Individual ID and Product Name, having them in separate DMOs forces the system to process all intermediate objects.
Design Principles for Cost-Efficient Data Models
Group Related Fields into the Same DMO
Consolidate customer attributes (name, address, phone, email) into a single Customer DMO.
1 DMO per entity
Scattered fields
Design for Consumption, Not Storage
Ask: "What fields do my segments and activations need together?" and model accordingly.
Query-optimized
Source mirroring
Minimize Unnecessary Relationships
Only create DMO relationships your segments actually need to traverse. Each is a cost-adding query path.
1–2 hops max
3+ DMO joins
Use Engagement Data Type Wisely
Classify time-series data (clicks, page views, transactions) as Engagement for date-based partitioning.
Date partitioned
Flat profile data
Success Metric: If your most common segment or activation traverses more than 3 DMOs, your data model likely needs redesign. The target is 1-2 hops for the most frequent operations.
9
Monitoring Credit Usage with Digital Wallet
The Salesforce Digital Wallet is your primary tool for monitoring and managing Data 360 credit consumption. According to the Salesforce Admin blog, recent enhancements provide granular visibility into consumption drivers at the feature level.
Accessing the Digital Wallet
1
Grant "View Consumption" Permission
Add the "View Consumption" permission to profiles or permission sets for users who need to monitor credit usage.
Setup → Permission Sets
2
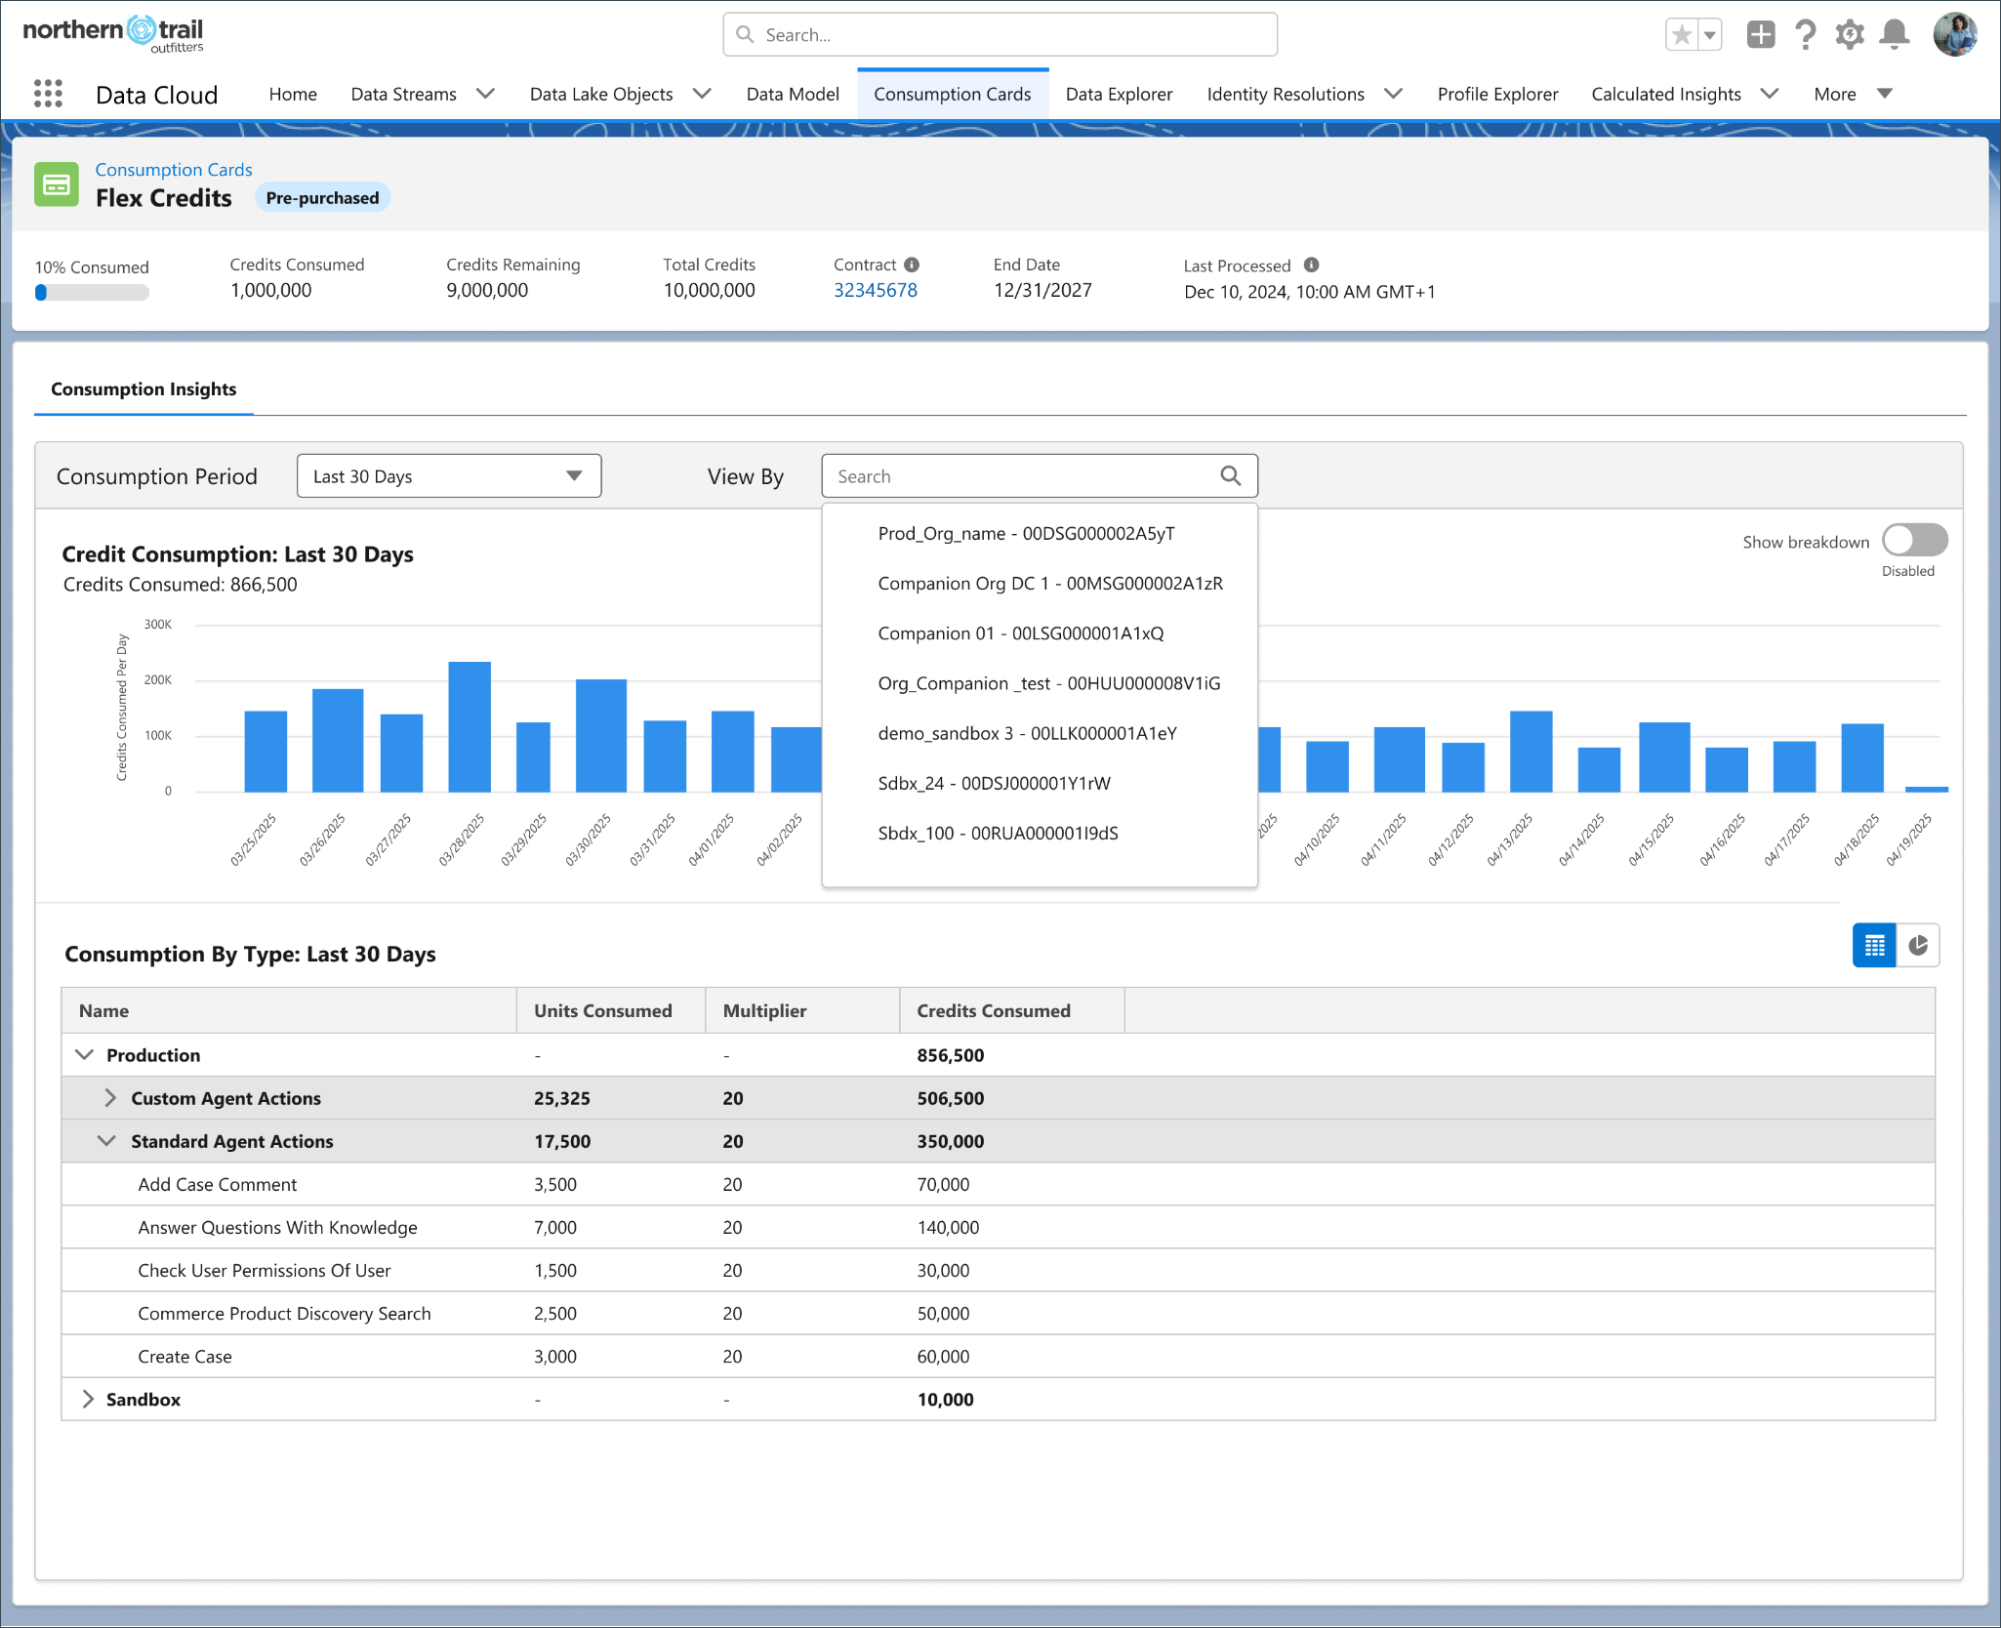
Open Consumption Cards
Search for "Consumption Cards" in App Launcher. Each card shows total allocation vs. remaining credits, usage trends, and breakdowns by type and org.
App Launcher → Consumption Cards
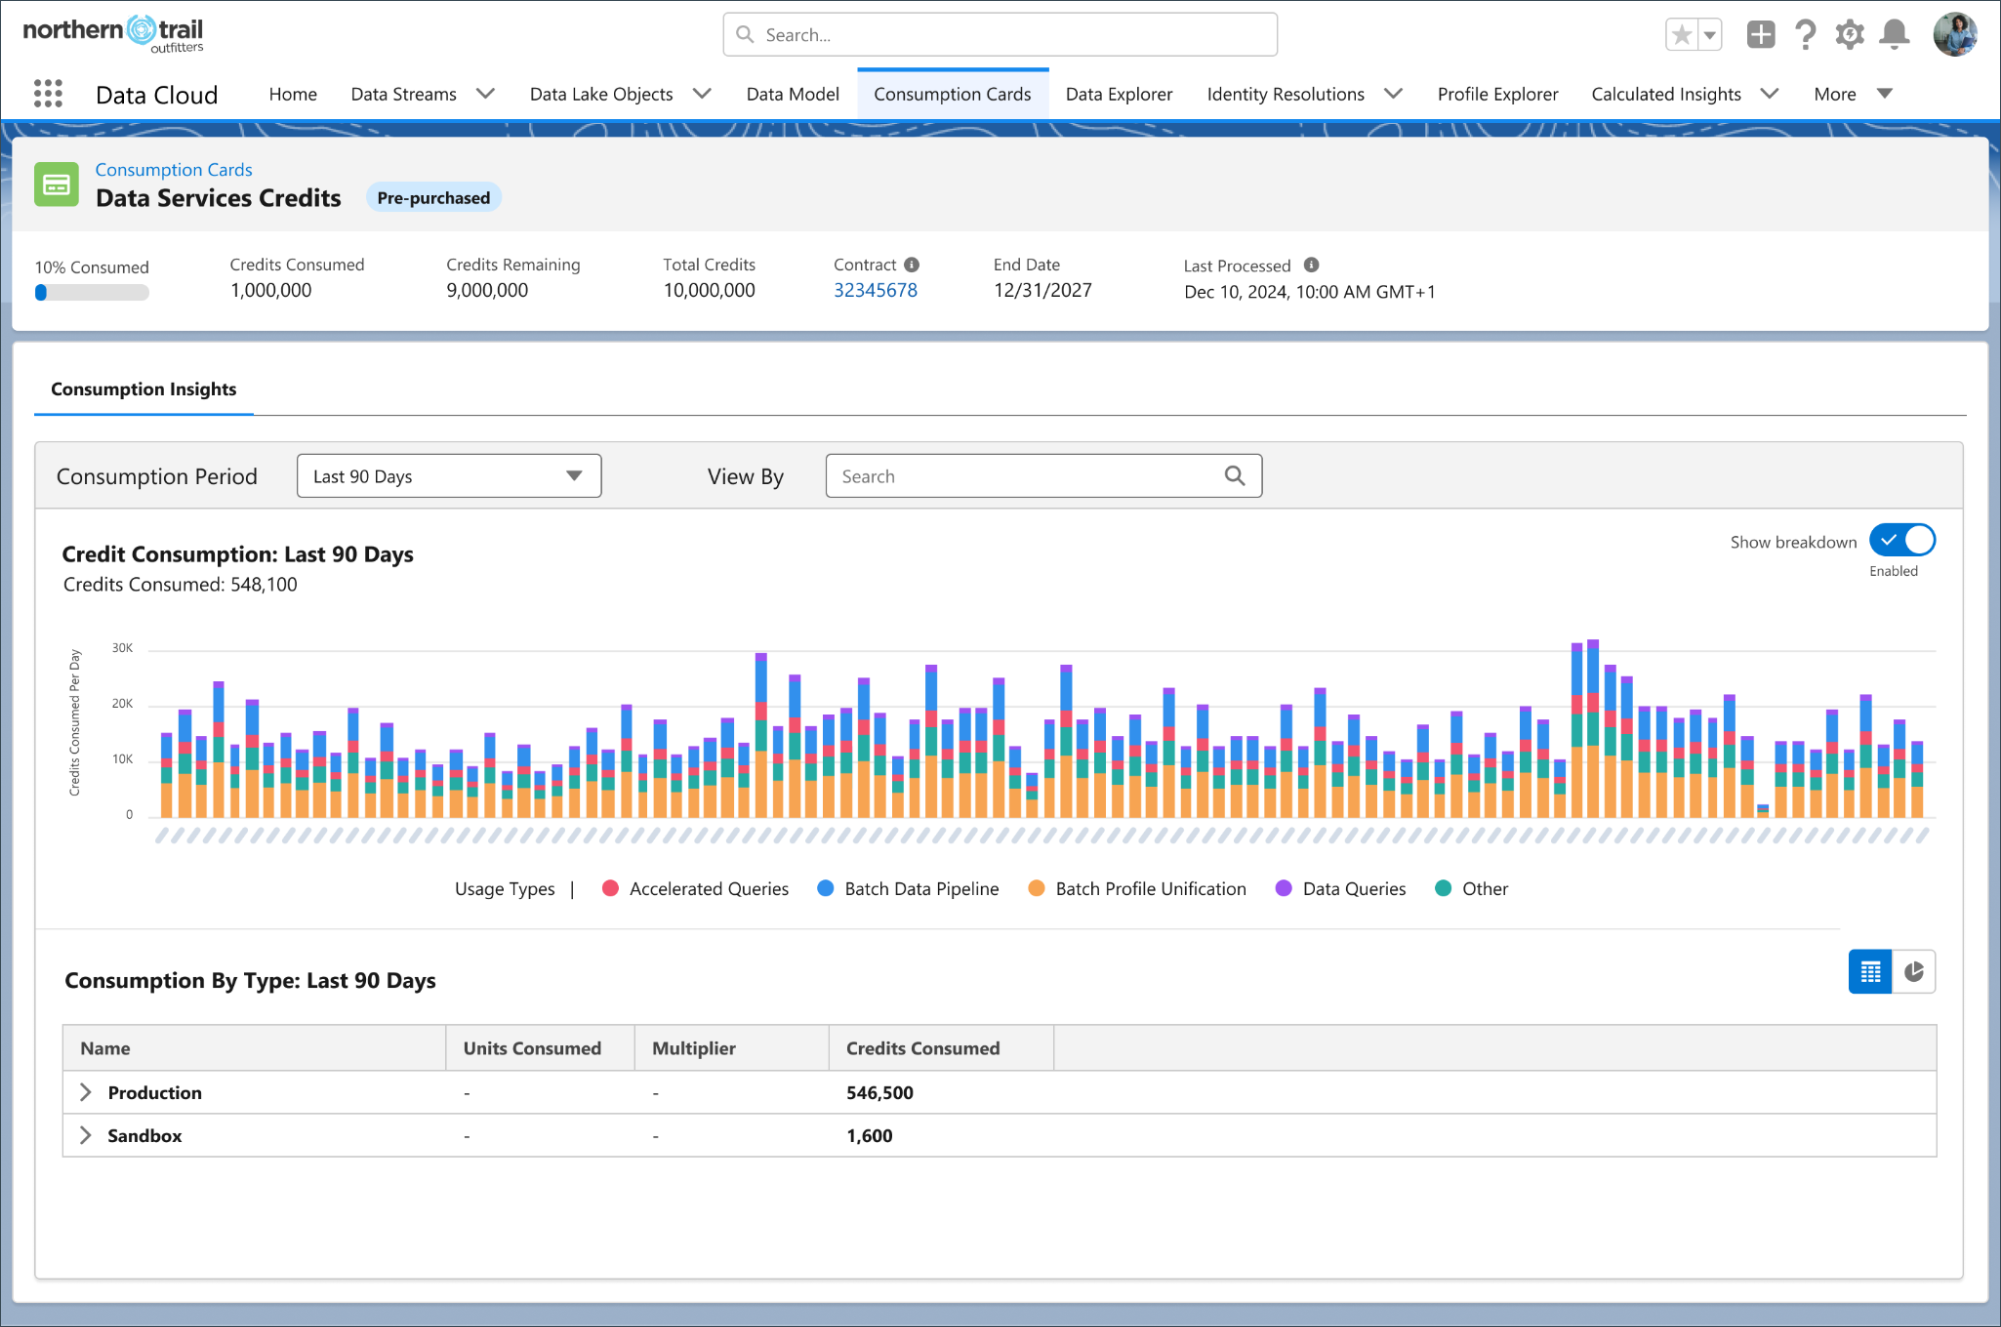
3
View Consumption Details
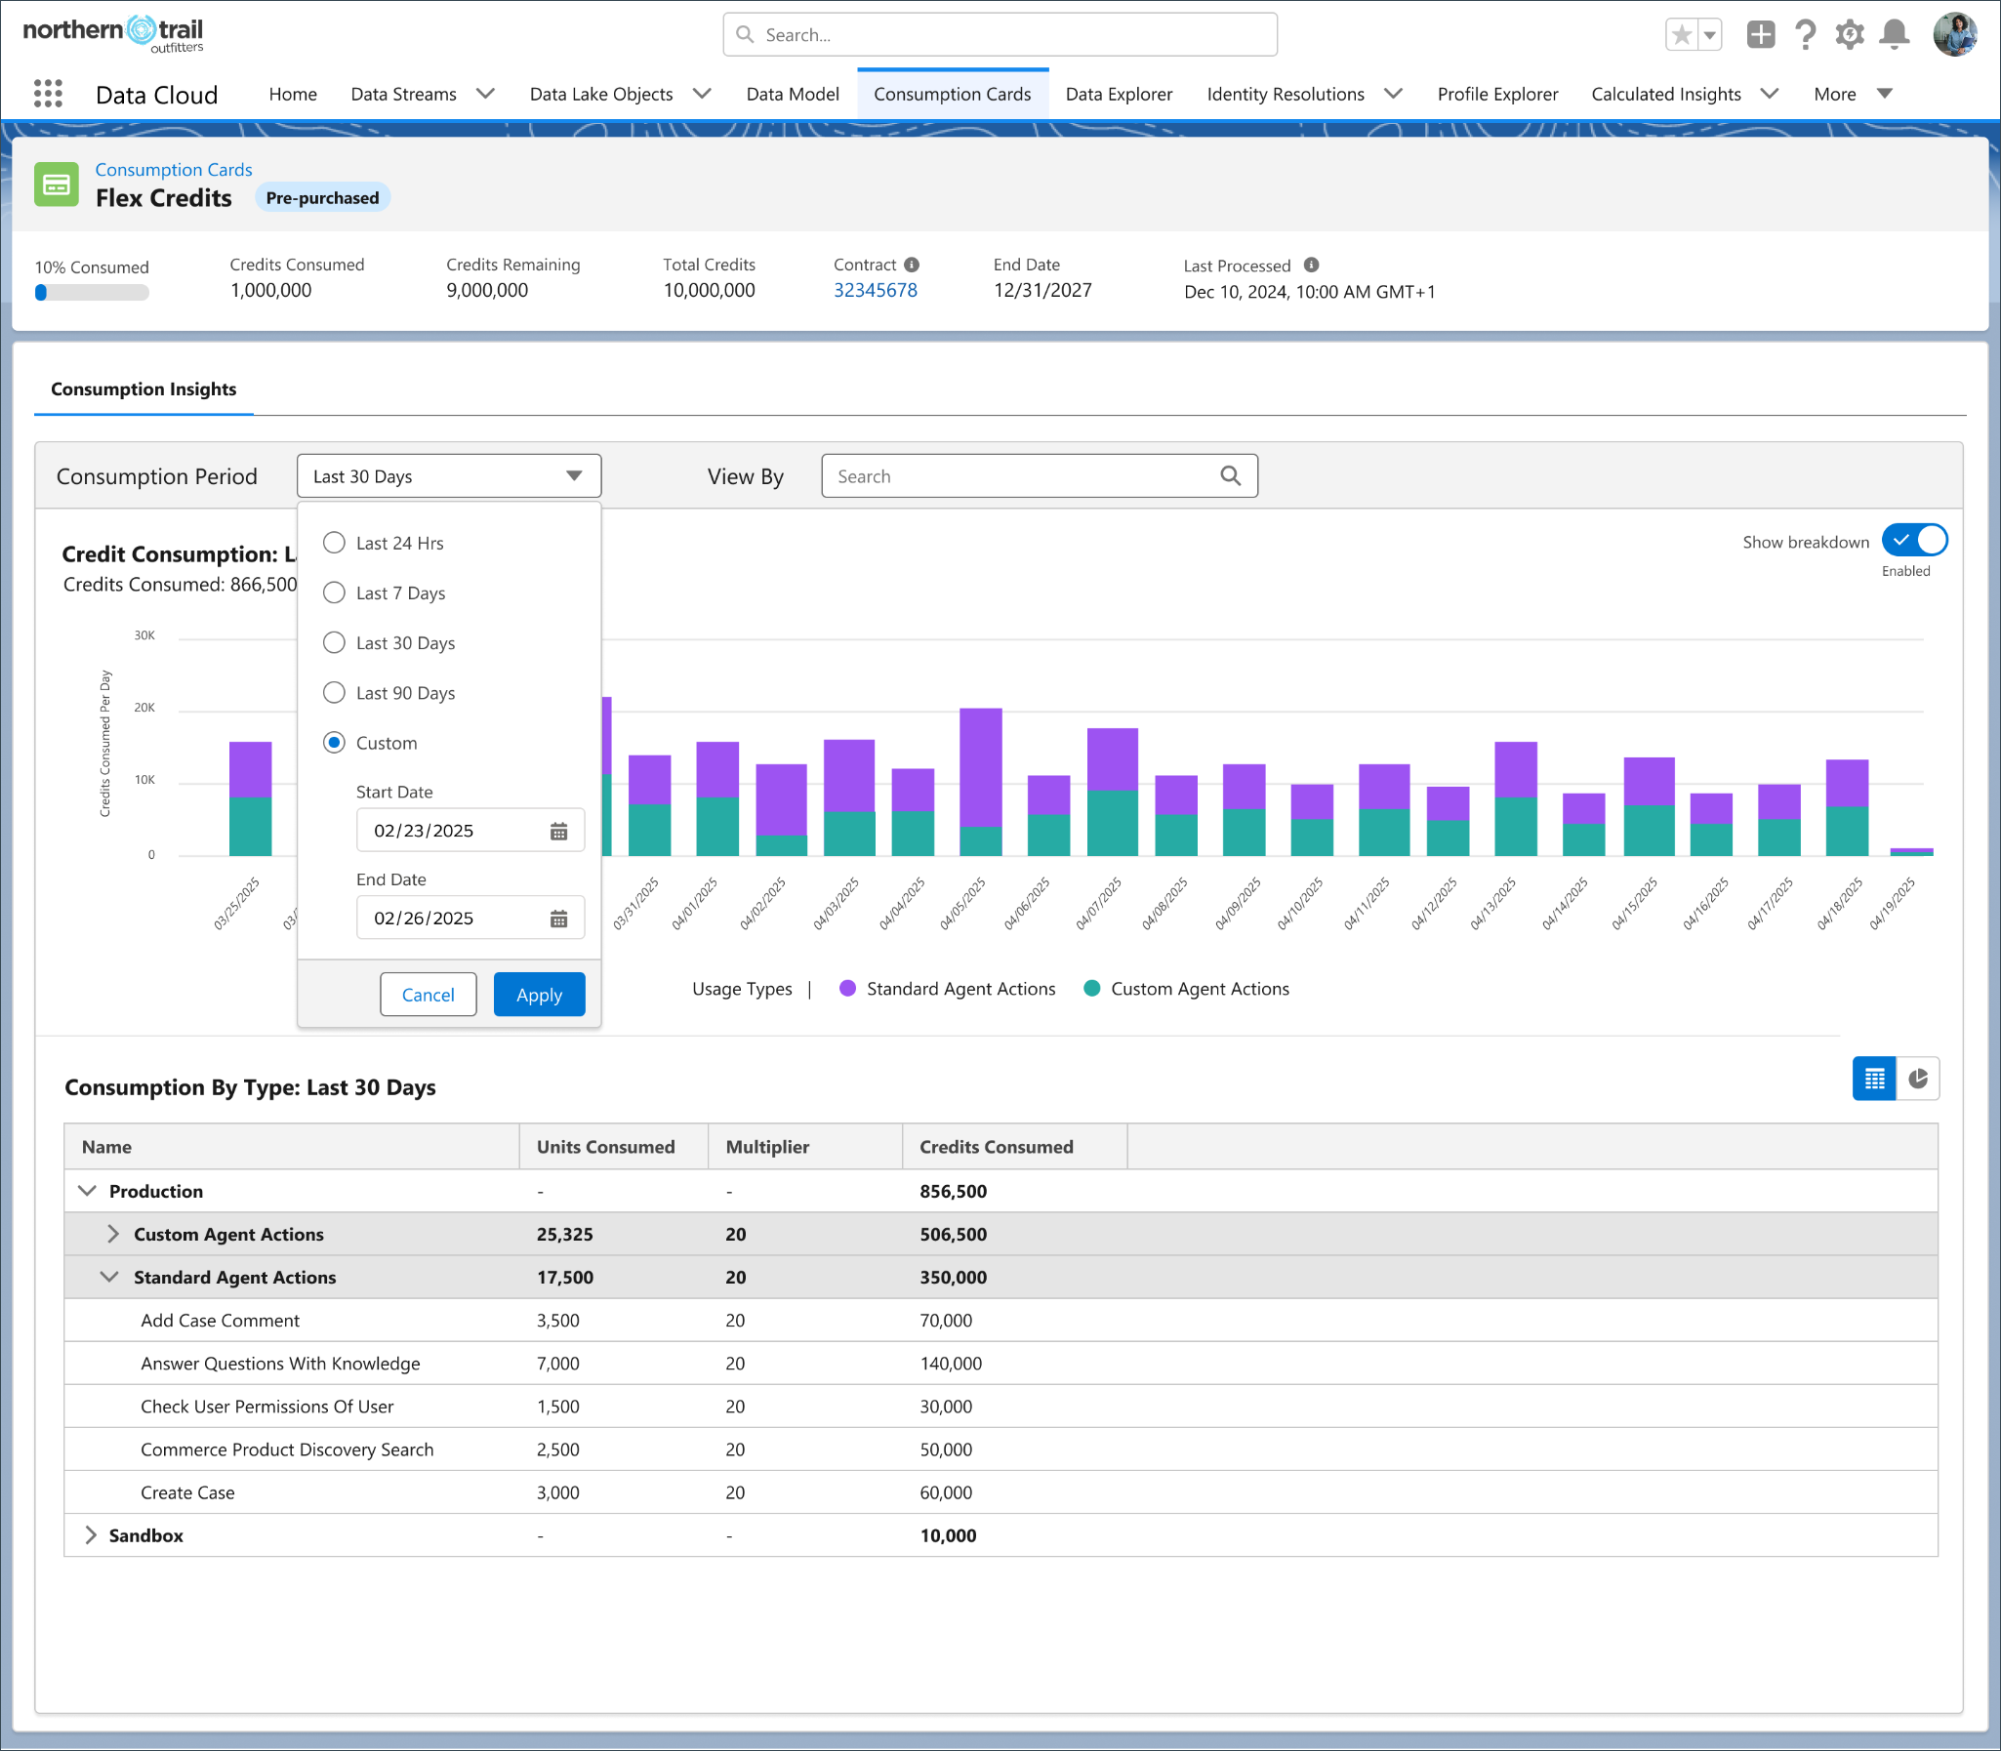
Click into any card to see usage patterns, date-range views (24h/7d/30d/90d), and stacked breakdowns by usage type.
24h / 7d / 30d / 90d
Data Services Credits - Consumption Dashboard - The Consumption Cards view shows 90-day credit usage trends broken down by operation type including Batch Data Pipeline, Batch Profile Unification, Accelerated Queries, and Data Queries. Note the Production vs. Sandbox breakdown in the table below.
Source: Salesforce Data 360 Digital WalletFlex Credits - Agent Actions Consumption - The Flex Credits card shows credit consumption by Custom Agent Actions (multiplier 28) and Standard Agent Actions (multiplier 20), with per-action detail for operations like Add Case Comment, Answer Questions With Knowledge, and Commerce Product Discovery Search.
Source: Salesforce Data 360 Digital WalletFlex Credits - Multi-Org Filtering - Use the "View By" filter to isolate credit consumption by specific org, companion org, or sandbox. This is essential for organizations with multiple Salesforce instances sharing a single credit pool.
Source: Salesforce Data 360 Digital Wallet
Setting Up Consumption Alerts
As documented in the Salesforce Help guide on threshold alerts, you can create Flow-based notifications that trigger when consumption reaches predefined thresholds.
Flow Configuration
# Alert Configuration Steps:
# 1. Navigate to Setup > Flows
# 2. Find "Consumption Threshold Alerts" template
# 3. Configure these key parameters:

AlertTriggerType: "ThresholdPercent"
ThresholdValues: [25, 50, 75, 90]   # Alert at these percentages
cardDefinitionDeveloperName: "DataCloudCard"

# This sends email notifications when consumption
# hits 25%, 50%, 75%, and 90% of allocated credits
Building Custom Consumption Reports
According to the Salesforce Release Notes, you can build reports on the TenantEnrichedUsageEvent data lake object (DLO) using Data 360 resource type usage tags. This allows you to:
Identify top consumers: See which specific data streams, transforms, or segments consume the most credits
Correlate with business value: Map credit consumption to specific use cases and evaluate ROI
Detect anomalies: Spot unexpected spikes in credit consumption before they become budget issues
Track by org: Differentiate sandbox vs. production consumption (sandbox usage now counts against production credits as of June 2025)
Sandbox Alert: As documented in the sandbox billing considerations, starting June 2025, sandbox Data 360 usage consumes production credits. Data streams replicated from production begin ingesting data and consuming credits immediately when you create a sandbox. Disable unnecessary data streams in sandbox environments.
10
Credit Governance Framework & Best Practices
Successful Data 360 implementations share common governance practices that transform credit management from a reactive exercise into a proactive discipline. The Trailhead credit consumption module outlines several foundational strategies for managing costs effectively.
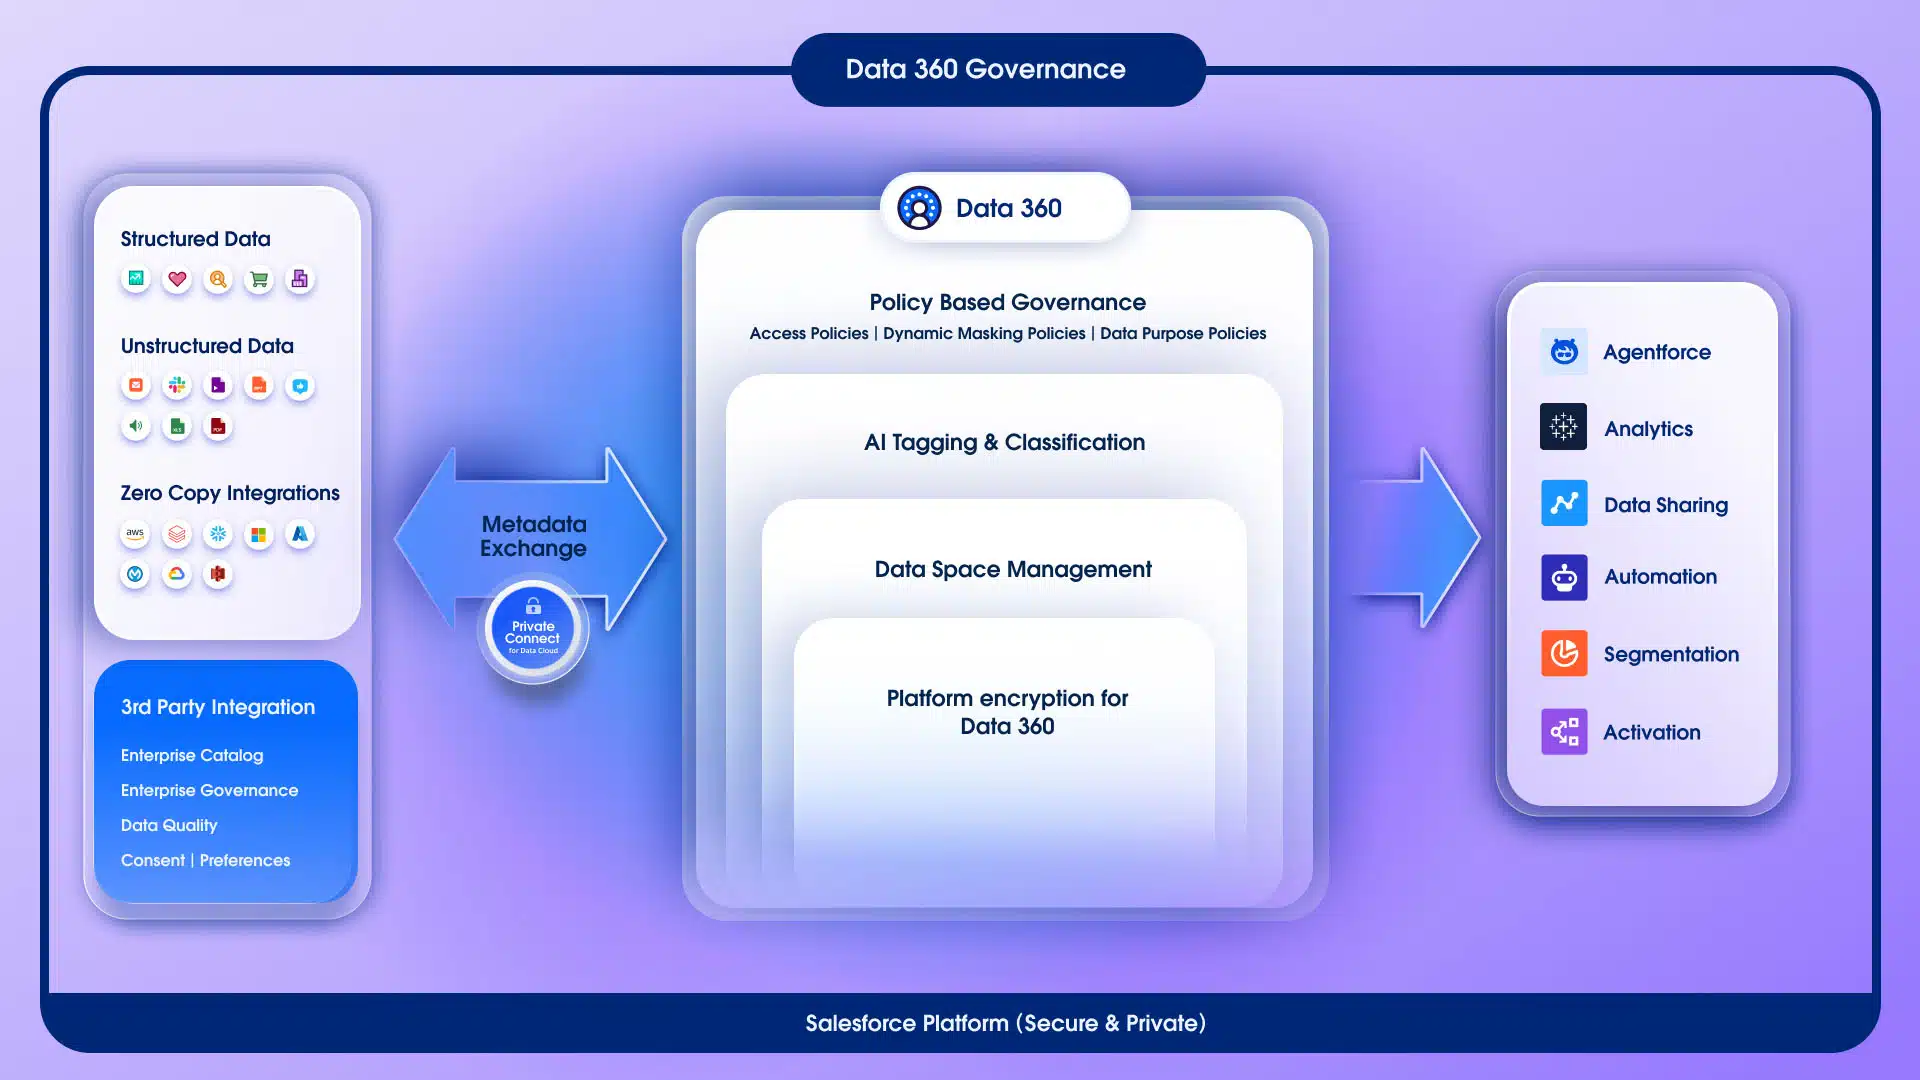
Data 360 Governance Architecture - End-to-end data flow showing how structured data, unstructured data, and zero-copy integrations enter Data 360 through Private Connect with metadata exchange. Governance layers include Policy Based Governance (access, masking, and purpose policies), AI Tagging & Classification, Data Space Management, and Platform Encryption. Governed data flows out to Agentforce, Analytics, Data Sharing, Automation, Segmentation, and Activation.
Source: Salesforce Data 360
The Credit Optimization Checklist
53x Save
Default to Batch Processing
Use streaming only for decisions that must be made in under 15 minutes. This single decision can reduce calculated insight costs by up to 53x.
Quick Win
Deactivate Unused Resources
Regularly audit and deactivate outdated segments, data streams, calculated insights, and transforms that no longer serve business needs.
Data Diet
Bring in Only Relevant Data
Limit profiles to those active within the last year. Filter out records with null values in fields critical to your activation use cases.
97% Save
Reduce Processing Frequency
If a calculated insight use case isn't time-sensitive, set it to refresh daily instead of hourly. Moving from hourly to daily can reduce insight costs by up to 97%.
Tiered
Implement Tiered Refresh Schedules
Real-time metrics: refresh hourly. Daily decision metrics: refresh daily. Weekly/monthly reports: refresh weekly. Some organizations implement conditional refresh only when input data changes.
Holistic
Track Credits Across the Pipeline
Monitor end-to-end from ingestion through unification through activation. Decisions at early stages cascade into costs at later stages.
Essential
Use the Pricing Calculator Before Implementation
Model your expected usage across all three pricing models to estimate total cost of ownership before building.
Plan Your Budget with the Official Calculator
Compare credit-based, profile-based, and flex credit pricing scenarios for your specific data volumes, segmentation patterns, and activation needs.
The math on calculated insight refresh frequency is compelling. Consider an organization with 50 insights processing 100 million rows each. At the batch calculated insight rate of 15 credits per million rows, each refresh costs 50 × 100 × 15 = 75,000 credits. The total cost then scales linearly with how often you refresh:
Monthly Credit Cost by Refresh Frequency
50 insights × 100M rows each
Hourly 24x/day • 1.8M credits daily
54,000,000 credits/mo
Baseline
Most expensive
Every 4 Hours 6x/day • 450K credits daily
13.5M credits/mo
75%
Savings vs hourly
Daily 1x/day • 75K credits daily
2.25M credits/mo
96%
Savings vs hourly
Weekly 1x/week • 10.7K credits daily
321K credits/mo
99.4%
Savings vs hourly
Quick Win: Simply moving non-time-sensitive calculated insights from hourly to daily refresh can save over 96% of insight-related credit costs. This is often the single fastest optimization you can implement.
11
Frequently Asked Questions
Data 360 (formerly Data Cloud, rebranded October 2025) offers three pricing models as of March 2026: credit-based consumption, profile-based SKUs ($240-$420 per 1,000 profiles), and flex credits. For the credit-based model, Credits = (Data Volume / 1,000,000) x Multiplier. Each operation type has a different multiplier, ranging from 2 credits for data queries to 100,000 credits for identity resolution per million rows. Credits are fungible across all features.
Identity Resolution (Profile Unification) is the most expensive operation at 100,000 credits per million rows processed, whether batch or streaming. This is 50x more expensive than external data ingestion (2,000 credits) and 6,667x more expensive than batch calculated insights (15 credits). It reflects the computational complexity of matching records across multiple data sources to create unified customer profiles.
Key strategies include: filtering data upstream before ingestion to remove unnecessary records and fields, defaulting to batch processing instead of streaming (up to 53x cheaper for calculated insights), optimizing identity resolution match rules for precision, reducing calculated insight refresh frequency from hourly to daily (96% savings), deactivating unused segments and data streams, and designing flat data models that minimize join complexity during segmentation and activation.
Yes. As of mid-2025, ingesting structured data from Salesforce applications (Sales Cloud, Service Cloud, Marketing Cloud Engagement, Marketing Cloud Personalization, and Commerce Cloud) using native connectors costs zero credits. This was a significant pricing change that addressed customer complaints about "paying twice" for their own data. External data sources still cost 2,000 credits per million rows in batch mode and 5,000 in streaming mode.
Use the Digital Wallet via the Consumption Cards tab in App Launcher (requires "View Consumption" permission). It shows total allocation vs. remaining credits, usage trends with date-range views, and breakdowns by usage type and org. You can set up threshold alerts using Flows to get notified at 25%, 50%, 75%, and 90% consumption levels. For deeper analysis, build custom reports on the TenantEnrichedUsageEvent data lake object to track consumption by specific data streams, transforms, and segments.
12
Abbreviations & Glossary
Abbreviations & Glossary
Reference guide for technical terms and abbreviations used throughout this article.