Master all debugging techniques for Salesforce OmniScript - from built-in tools to advanced browser debugging and third-party solutions
10+
Debugging Methods
4
Chrome Extensions
2
Built-in Debuggers
3
Runtime Modes
1
Built-in OmniScript Designer Tools
OmniStudio provides two primary built-in debugging tools directly within the OmniScript Designer. These tools are your first line of defense when troubleshooting OmniScript issues.
Data JSON Panel Built-in
The Data JSON panel displays the real-time data structure formed by JSON code during OmniScript execution, as detailed in OmniScript advanced concepts.
View and confirm keys and their values
JSON updates automatically when values are entered in data fields
Copy entire JSON with a single click for testing
Easy-to-read format for quick validation
Action Debugger Built-in
Displays a searchable log of every action that runs, with detailed request/response data per Salesforce best practices.
Debug action requests and response data
Search for specific actions in the log
Expand nodes to see data sent to/from servers
Copy specific nodes with one click
Clear console log as needed
Preview Mode Features
The Preview functionality offers several debugging-adjacent capabilities as shown in the Trailhead OmniScript tutorial:
Image #1: OmniScript Designer showing the Preview canvas with Data JSON panel (left) displaying real-time JSON data structure,
and Action Debugger panel (right) for monitoring action requests and responses.
Context ID Testing: Enter a RecordId into the Context ID field to preview your form with live data, or use stub data for automated testing
Device Simulation: Test how OmniScripts appear on different devices (mobile, desktop, tablet) using the Preview Device dropdown
Theme Switching: View your script with Lightning or Newport theme to verify styling consistency
Reset Data: Reload the canvas to reset data and update both the Data JSON and Action Debugger
Pro Tip
In the Action Debugger, you can confirm the actual value sent at runtime in the preview. The JSON shows the values sent to the service, including dynamically set options as explained in Trailhead's JSON preparation guide.
2
Browser DevTools for OmniStudio
Since OmniScript code executes on the client side, browser developer tools become essential for debugging. This section covers OmniStudio-specific JavaScript techniques to extract the complete page payload.
Get Complete OmniScript JSON Payload
Use these JavaScript commands in the browser console to extract the entire OmniScript data payload, as demonstrated in Rohitkumar Asare's debugging guide:
Method 1: Query All OmniScript Components
// Get all OmniScript step elements on the page
// For Standard Runtime (omnistudio namespace):
document.querySelectorAll('runtime_omnistudio-omniscript-step')

// For Vlocity/Managed Package Runtime:
document.querySelectorAll('vlocity_cmt-omniscript-step')

// Get the first OmniScript step and access its JSON data:
let osStep = document.querySelector('runtime_omnistudio-omniscript-step');
console.log(osStep.jsonData);

// Pretty print the entire JSON payload:
JSON.stringify(osStep.jsonData, null, 2)
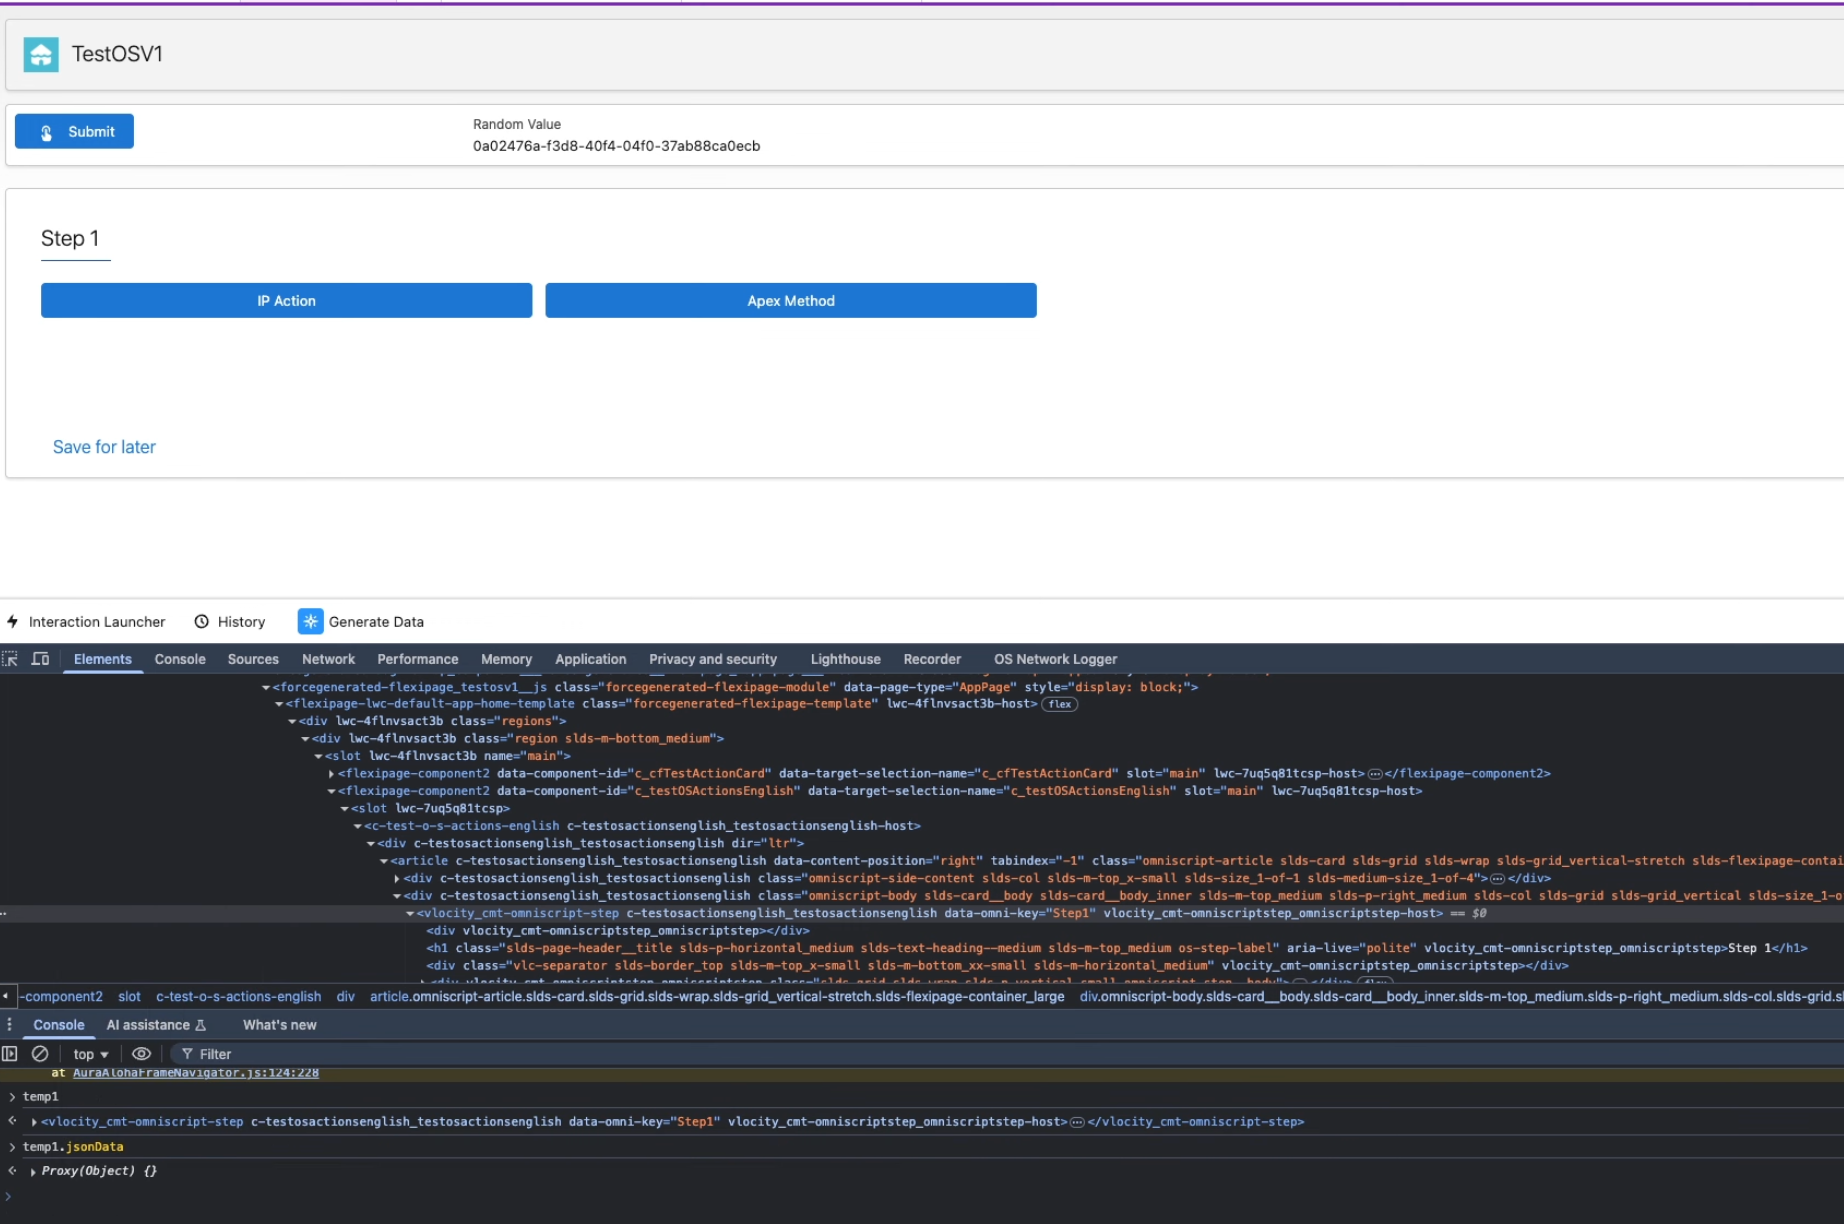
Method 2: Store Element as Global Variable
// Step 1: Open DevTools (F12) > Elements tab
// Step 2: Use element selector and find omniscript-step element
// Step 3: Right-click > "Store as global variable" (creates temp1)

// Step 4: Access the JSON data in Console:
temp1.jsonData

// Step 5: Get formatted JSON output:
JSON.stringify(temp1.jsonData, null, 2)

// Step 6: Copy to clipboard:
copy(JSON.stringify(temp1.jsonData, null, 2))
Image #2: Right-click on the OmniScript step element in DevTools Elements panel and select "Store as global variable" to create temp1.
Then in Console, type temp1.jsonData to access the complete OmniScript JSON payload.
Method 3: Access OmniScript from LWC Context
// If you have a custom LWC in the OmniScript, access via:
this.omniJsonData           // Returns the parsed JSON object
this.omniJsonDataStr        // Returns JSON as string

// Example in connectedCallback:
connectedCallback() {
    console.log('Full OmniScript Data:', this.omniJsonData);
    console.log('Specific field:', this.omniJsonData.Step1.FieldName);
}

// Push data back to OmniScript:
this.omniUpdateDataJson({ myField: 'newValue' });

// Apply response from external call:
this.omniApplyCallResp({ responseData: myData });
Network Tab - Capture OmniStudio Requests
Monitor network requests to debug Integration Procedures, Remote Actions, and Data Raptors:
Network Tab Steps for OmniStudio
1. Open DevTools (F12) > Network tab
2. Clear existing requests before triggering the action
3. Trigger the OmniScript action (button click, step navigation)
4. Filter by "Fetch/XHR" to see API calls
5. Look for ApexAction requests containing:
   "aura?r=XXX&aura.ApexAction.execute=1"
6. Click the request > Payload tab > Form Data
7. Find "message" field containing the JSON payload
8. Copy and use a JSON formatter to decode
Image #3: In the Network tab, click on the aura?r=XX&aura.ApexAction.execute=1 request,
then select the Payload tab. Under Form Data, locate the message field
which contains the complete JSON payload with namespace, classname, method, and params sent to Integration Procedures or Remote Actions.
OmniScriptBaseMixin Methods Reference
Available methods when extending OmniScriptBaseMixin in custom LWC components, documented at Salesforce Ben:
Method/Property
Description
Usage
omniJsonData
Get OmniScript JSON as object
this.omniJsonData
omniJsonDataStr
Get OmniScript JSON as string
this.omniJsonDataStr
omniUpdateDataJson()
Update data in OmniScript JSON
this.omniUpdateDataJson({key: value})
omniApplyCallResp()
Push external response to OmniScript
this.omniApplyCallResp(responseObj)
omniNextStep()
Navigate to next step
this.omniNextStep()
omniPrevStep()
Navigate to previous step
this.omniPrevStep()
Pro Tip: Quick Console Access
For the fastest access to OmniScript JSON, right-click on any OmniScript step in Elements panel, select "Store as global variable", then type temp1.jsonData in Console. This works in any environment including production.
3
Chrome Extensions for OmniStudio
Several Chrome extensions have been developed to streamline OmniStudio debugging, making it easier to inspect requests, identify components, and analyze data flow. These are available in the Chrome Web Store.
Compare and search across OmniStudio components and orgs.
Compare OmniScripts between orgs
Compare Integration Procedures and FlexCards
Quick search within elements and Data JSON
Faster debugging and development
4
Integration Procedure Debugging
Integration Procedures (IPs) have their own dedicated debugging tools within OmniStudio, allowing you to test and troubleshoot data flow between components as covered in the Trailhead Integration Procedures module.
Preview Tab Testing
The Preview tab in the Integration Procedure designer provides comprehensive testing capabilities:
Input Parameters Panel: Enter Key/Value pairs (e.g., AccountId and RecordId) to test with real data
Execute Button: Run the Integration Procedure and view results
Response Pane: Confirms data extraction is working correctly
The Debug Log includes two entries for each element:

NAME        - Shows the OUTPUT of the element
NAMEDebug   - Shows the INPUT for the step

Example:
AccountExtract      - Output data from DataRaptor
AccountExtractDebug - Input parameters sent to DataRaptor

If you don't see expected outputs, review the debug entry
to find what's wrong with the input data.
Response Action Debugging
The Response Action in an Integration Procedure serves multiple debugging functions:
Concludes the IP and appends additional data to JSON response
Facilitates conditional termination for testing scenarios
Trims data returning to browser to minimize data transfer
Aids in debugging by controlling output visibility
Common Issue
If you see data extracted by the DataRaptor in the Debug Log but the response is empty, it's likely that a Response Action was not added to the Integration Procedure.
5
Apex & Debug Logs
When OmniScripts call Remote Actions or Apex classes, standard Salesforce debug logs become essential for troubleshooting server-side logic.
Setting Up Trace Flags
Configure trace flags to capture debug logs for specific users or processes:
Trace Flag Setup Steps
1. Go to Setup > Debug Logs
2. Click "New Trace Flag"
3. Select Traced Entity Type:
   - User: Monitor specific user's activity
   - Apex Class: Log events for specific Apex class
   - Apex Trigger: Log events for specific trigger
   - Automated Process: For platform events and async processes
4. Set Debug Level (determines logging granularity)
5. Set Start Date and Expiration Date
6. Click Save
global with sharing class MyOmniScriptAction implements Callable {

    // Required method for Callable interface
    public Object call(String action, Map<String, Object> args) {
        Map<String, Object> input = (Map<String, Object>)args.get('input');
        Map<String, Object> output = (Map<String, Object>)args.get('output');
        Map<String, Object> options = (Map<String, Object>)args.get('options');

        // Add debug statements
        System.debug('Input: ' + JSON.serialize(input));

        return invokeMethod(action, input, output, options);
    }

    public Boolean invokeMethod(String methodName, Map<String, Object> input,
            Map<String, Object> output, Map<String, Object> options) {

        if (methodName == 'myAction') {
            // Your logic here
            System.debug('Executing myAction');
            output.put('result', 'Success');
            return true;
        }

        return false;
    }
}
Trace Flag Expiration
Trace Flags have an expiration date/time. If logs stop appearing mysteriously, check if the Trace Flag has expired and extend it as needed.
Debug OmniScript Input - Print All Parameters
One of the most useful debugging techniques is creating a simple Apex class that receives OmniScript input parameters and prints them exactly as received. This helps you understand the exact data structure being passed from OmniScript:
OmniScript Debug Helper Apex Class
global with sharing class OmniScriptDebugHelper implements Callable {

    /**
     * Debug helper class that prints all OmniScript input parameters
     * to the debug log exactly as received. Use this in Remote Actions
     * to see the complete data payload from OmniScript.
     */

    public Object call(String action, Map<String, Object> args) {
        Map<String, Object> input = (Map<String, Object>)args.get('input');
        Map<String, Object> output = (Map<String, Object>)args.get('output');
        Map<String, Object> options = (Map<String, Object>)args.get('options');

        return invokeMethod(action, input, output, options);
    }

    public Boolean invokeMethod(String methodName, Map<String, Object> input,
            Map<String, Object> output, Map<String, Object> options) {

        // Print the complete input JSON exactly as received
        System.debug('========== OMNISCRIPT DEBUG START ==========');
        System.debug('Method Name: ' + methodName);
        System.debug('----------------------------------------');
        System.debug('COMPLETE INPUT JSON:');
        System.debug(JSON.serializePretty(input));
        System.debug('----------------------------------------');
        System.debug('OPTIONS:');
        System.debug(JSON.serializePretty(options));
        System.debug('========== OMNISCRIPT DEBUG END ==========');

        // Return the input back to OmniScript for verification
        output.put('debugInput', input);
        output.put('debugMethod', methodName);
        output.put('debugTimestamp', System.now());

        return true;
    }
}
Usage Tip
Add this class as a Remote Action in your OmniScript, then open the Debug Logs in Salesforce Setup. When the action executes, you'll see the complete JSON payload formatted clearly in the logs. This is especially useful when troubleshooting data mapping issues between OmniScript steps and server-side actions.
6
Custom LWC Debugging
When extending OmniScript with custom Lightning Web Components, specific debugging techniques apply to ensure your components work correctly within the OmniScript context.
OmniScriptBaseMixin
Custom LWCs for OmniScript must extend OmniScriptBaseMixin instead of LightningElement:
Custom LWC Template
import { OmniScriptBaseMixin } from 'omnistudio/omniscriptBaseMixin';

export default class MyCustomComponent extends OmniScriptBaseMixin {

    connectedCallback() {
        super.connectedCallback();

        // Access OmniScript data JSON
        console.log('OmniScript Data:', this.omniJsonDataStr);

        // Parse the JSON data
        const omniData = JSON.parse(this.omniJsonDataStr);
        console.log('Parsed Data:', omniData);
    }

    renderedCallback() {
        // Debug after render
        console.log('Component rendered');
    }

    handleClick() {
        // Update OmniScript data
        this.omniUpdateDataJson({
            myField: 'newValue'
        });

        console.log('Data updated');
    }
}
Common console.log Issues
If console.log statements aren't appearing, check these common causes:
Issue
Cause
Solution
Logs not appearing
Console filter set incorrectly
Set console to "All levels" or "Verbose"
Constructor logs missing
Component not fully initialized
Use connectedCallback() or renderedCallback() instead
No logs at all
Component not rendered on page
Verify component is added to Lightning page/app
Conditional render issues
Render conditions not met
Check visibility conditions are satisfied
Debugging Tip
Use the debugger; statement to pause execution and inspect variables directly in browser DevTools. This is often more effective than multiple console.log statements.
7
Best Practices & Tips
Follow these best practices to make OmniScript debugging more efficient and effective.
Development Best Practices
Modular Design
Break complex OmniScripts into smaller, modular components for easier debugging as recommended by Apex Hours.
Use sub-flows for reusable functionality
Create separate Integration Procedures for each data operation
Isolate complex logic for targeted testing
Error Handling
Implement comprehensive error handling to catch and surface issues early per Cloud Foundation's guide.
Maintain clean, testable Apex code for Remote Actions.
Create separate classes for different OmniScripts
Avoid putting all logic in one super class
Write unit tests for each Apex class
Debugging Checklist
Step
Tool/Method
Purpose
1
Data JSON Panel
Verify data structure and values
2
Action Debugger
Check request/response for actions
3
Browser Console
Look for JavaScript errors
4
Network Tab
Inspect API calls and responses
5
IP Debug Log
Review Integration Procedure steps
6
Salesforce Debug Logs
Debug Apex/Remote Actions
7
Chrome Extensions
Automated request logging
Quick Tip
When troubleshooting in production, use the Browser DevTools technique (Section 2) with temp1.jsonData combined with the OmniStudio Network Logger extension (Section 3) for comprehensive visibility without needing Designer access.
Common Issues and Solutions
Issue
Likely Cause
Solution
Preview works but runtime fails
Missing dependencies in target org
Run smoke tests on all components
FlexCard not displaying data
Empty Data Node field or wrong RecordId
Check Data Node configuration and Test Data Source