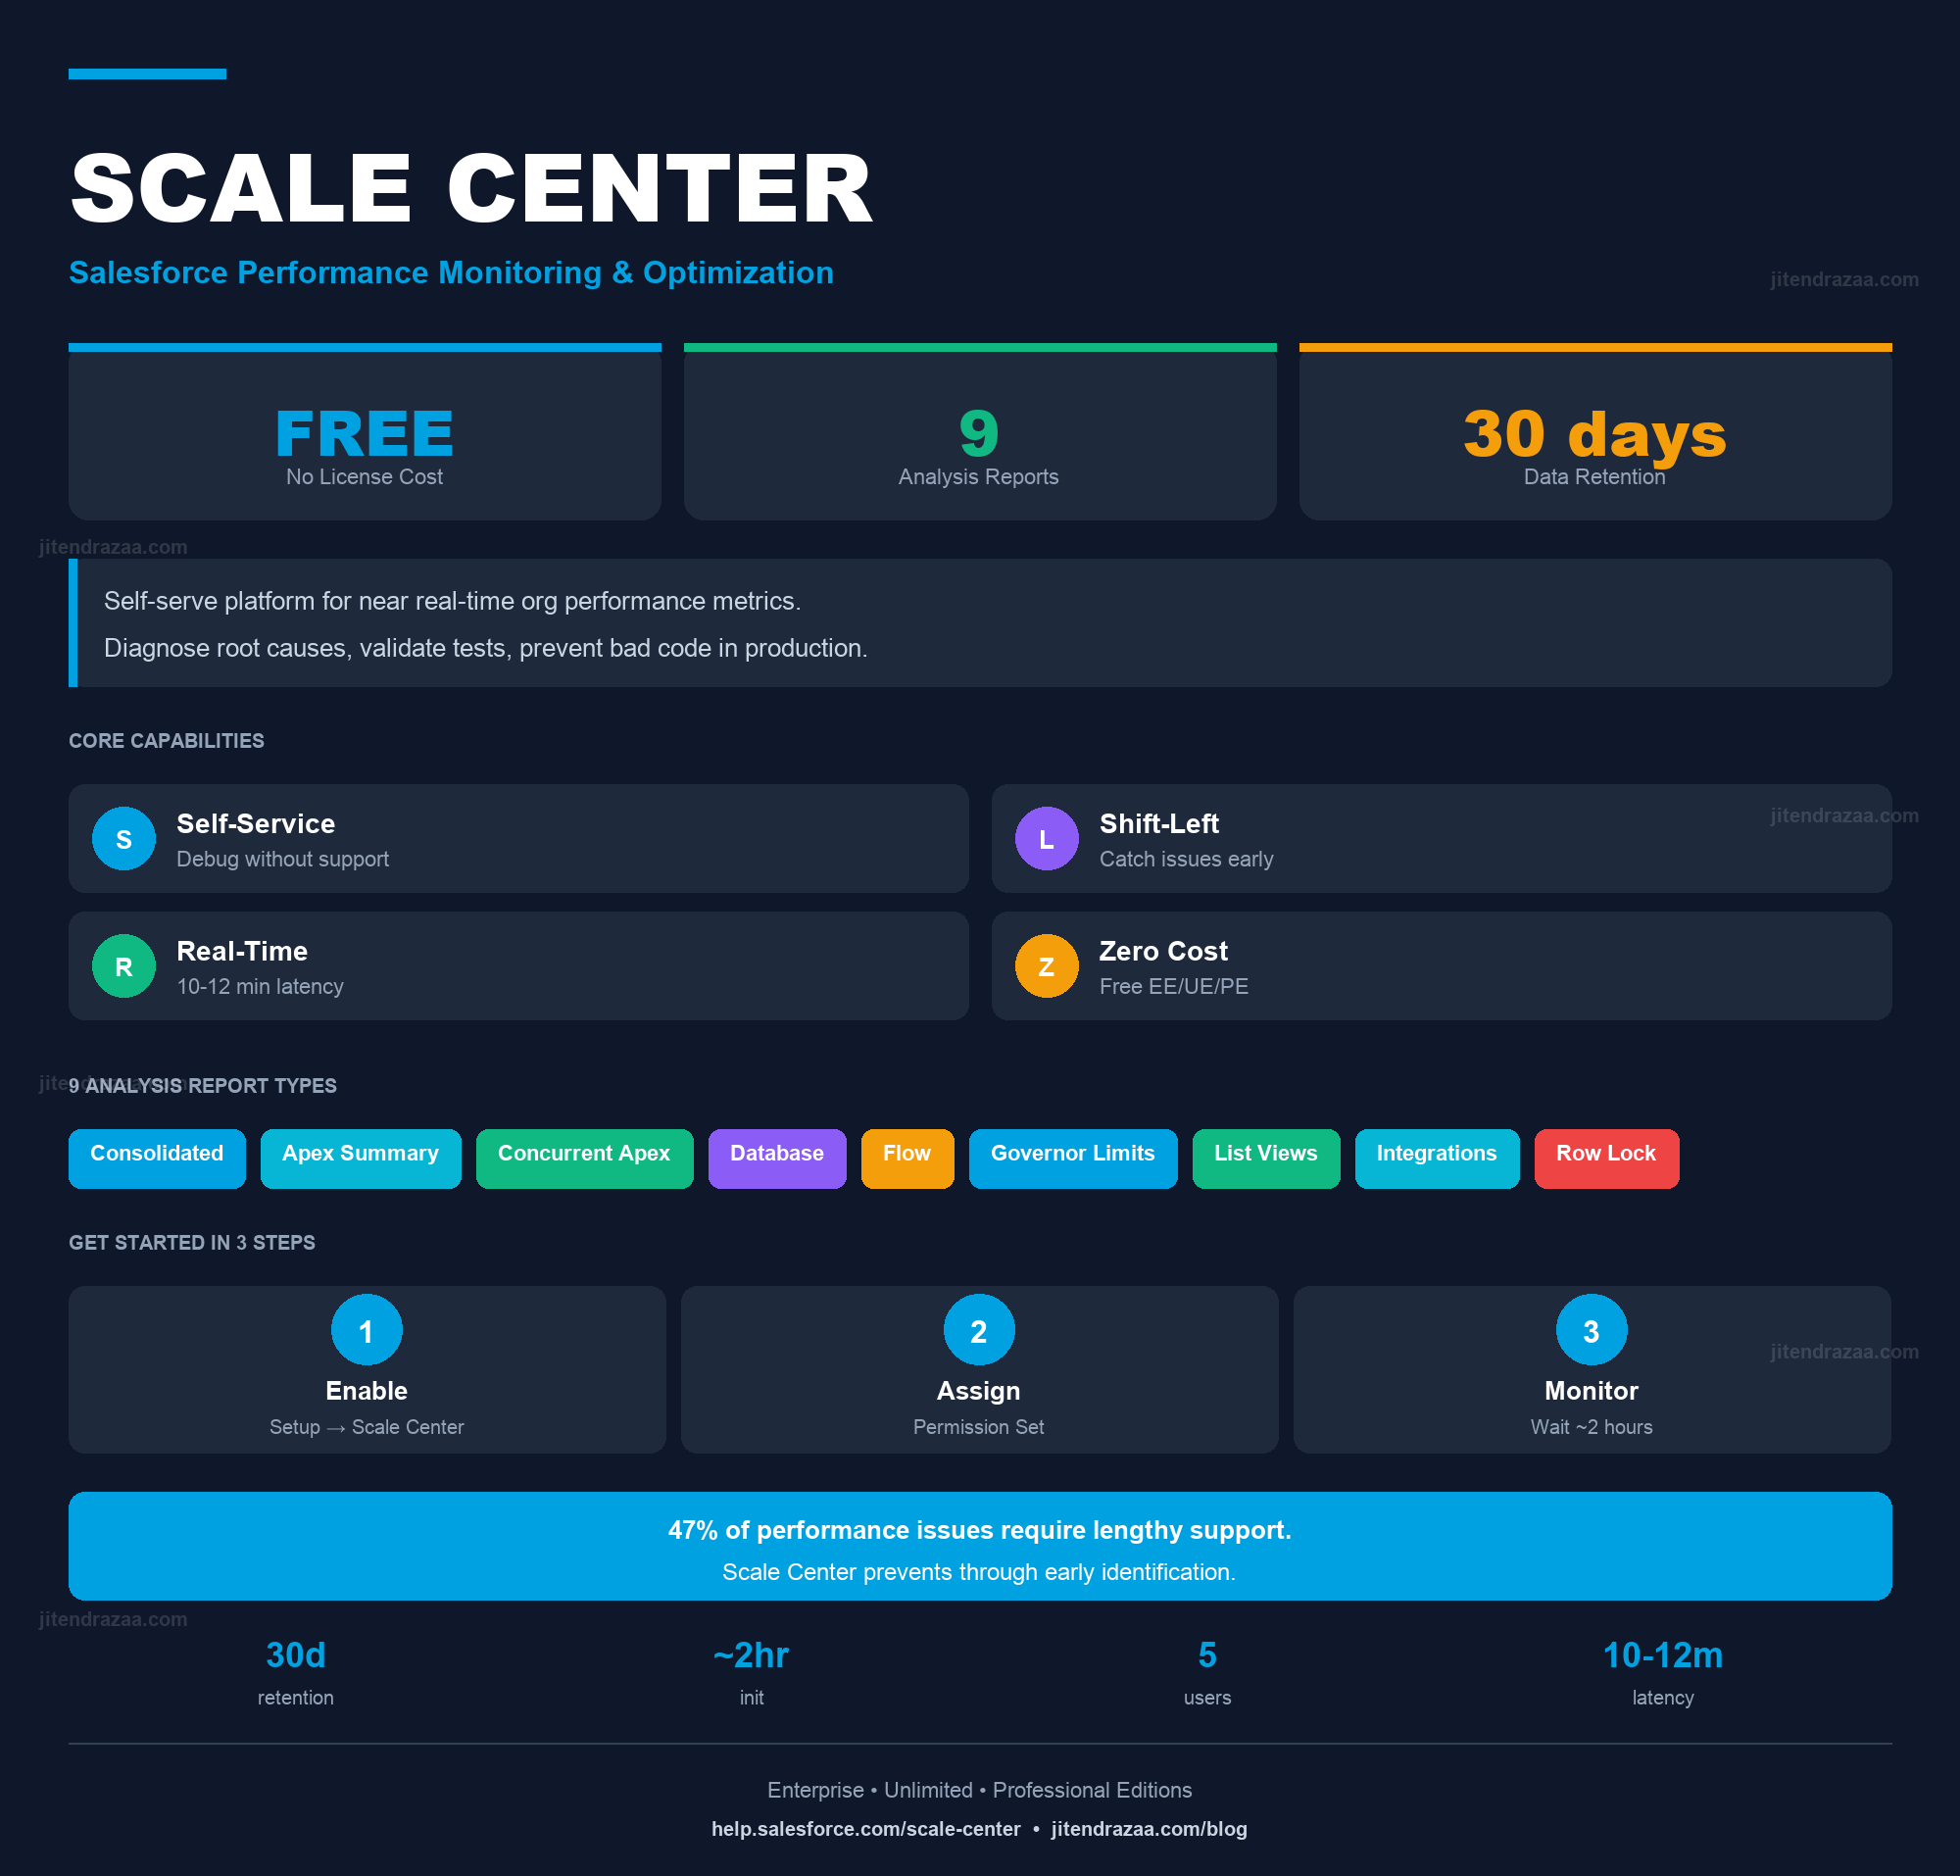
Visual overview of Salesforce Scale Center capabilities, benefits, and getting started steps
Master performance monitoring, optimization, and scalability assessment with Salesforce's self-serve platform for enterprise application health
Visual overview of Salesforce Scale Center capabilities, benefits, and getting started steps
Salesforce Scale Center represents a paradigm shift in how organizations approach performance monitoring and scalability assessment across their Salesforce implementations. According to Salesforce Trailhead documentation, Scale Center emerged from recognition that traditional performance monitoring approaches often identify issues too late in the development cycle, requiring expensive remediation efforts after code has already been deployed to production.
The platform provides self-serve, near real-time access to comprehensive org performance metrics, enabling development teams, architects, administrators, and performance engineers to proactively identify and resolve performance bottlenecks before they impact end-users. As stated in the official Salesforce Help documentation, Scale Center democratizes performance engineering by making scalability assessment accessible to all members of the technical team.
Organizations often discover scalability issues only when end-users begin reporting degraded performance, at which point the system has reached a critical tipping point where it can no longer scale effectively to handle unexpected events or peak demand periods. At this juncture, addressing the underlying issues requires significant time and financial resources devoted to troubleshooting, redesigning, and refactoring existing implementations.
Furthermore, scalability issues compound over time, creating cascading performance problems that consume development and maintenance resources that could otherwise be directed toward building new features. By enabling early identification and resolution of potential performance bottlenecks, Scale Center fundamentally changes the economics and timelines of Salesforce optimization efforts.
Scale Center delivers a comprehensive suite of interconnected capabilities designed to address multiple dimensions of performance monitoring and optimization across the entire Salesforce platform. The core architecture encompasses two primary functional domains: the Org Performance page for high-level visibility, and the Performance Analysis engine for deep-dive investigations.
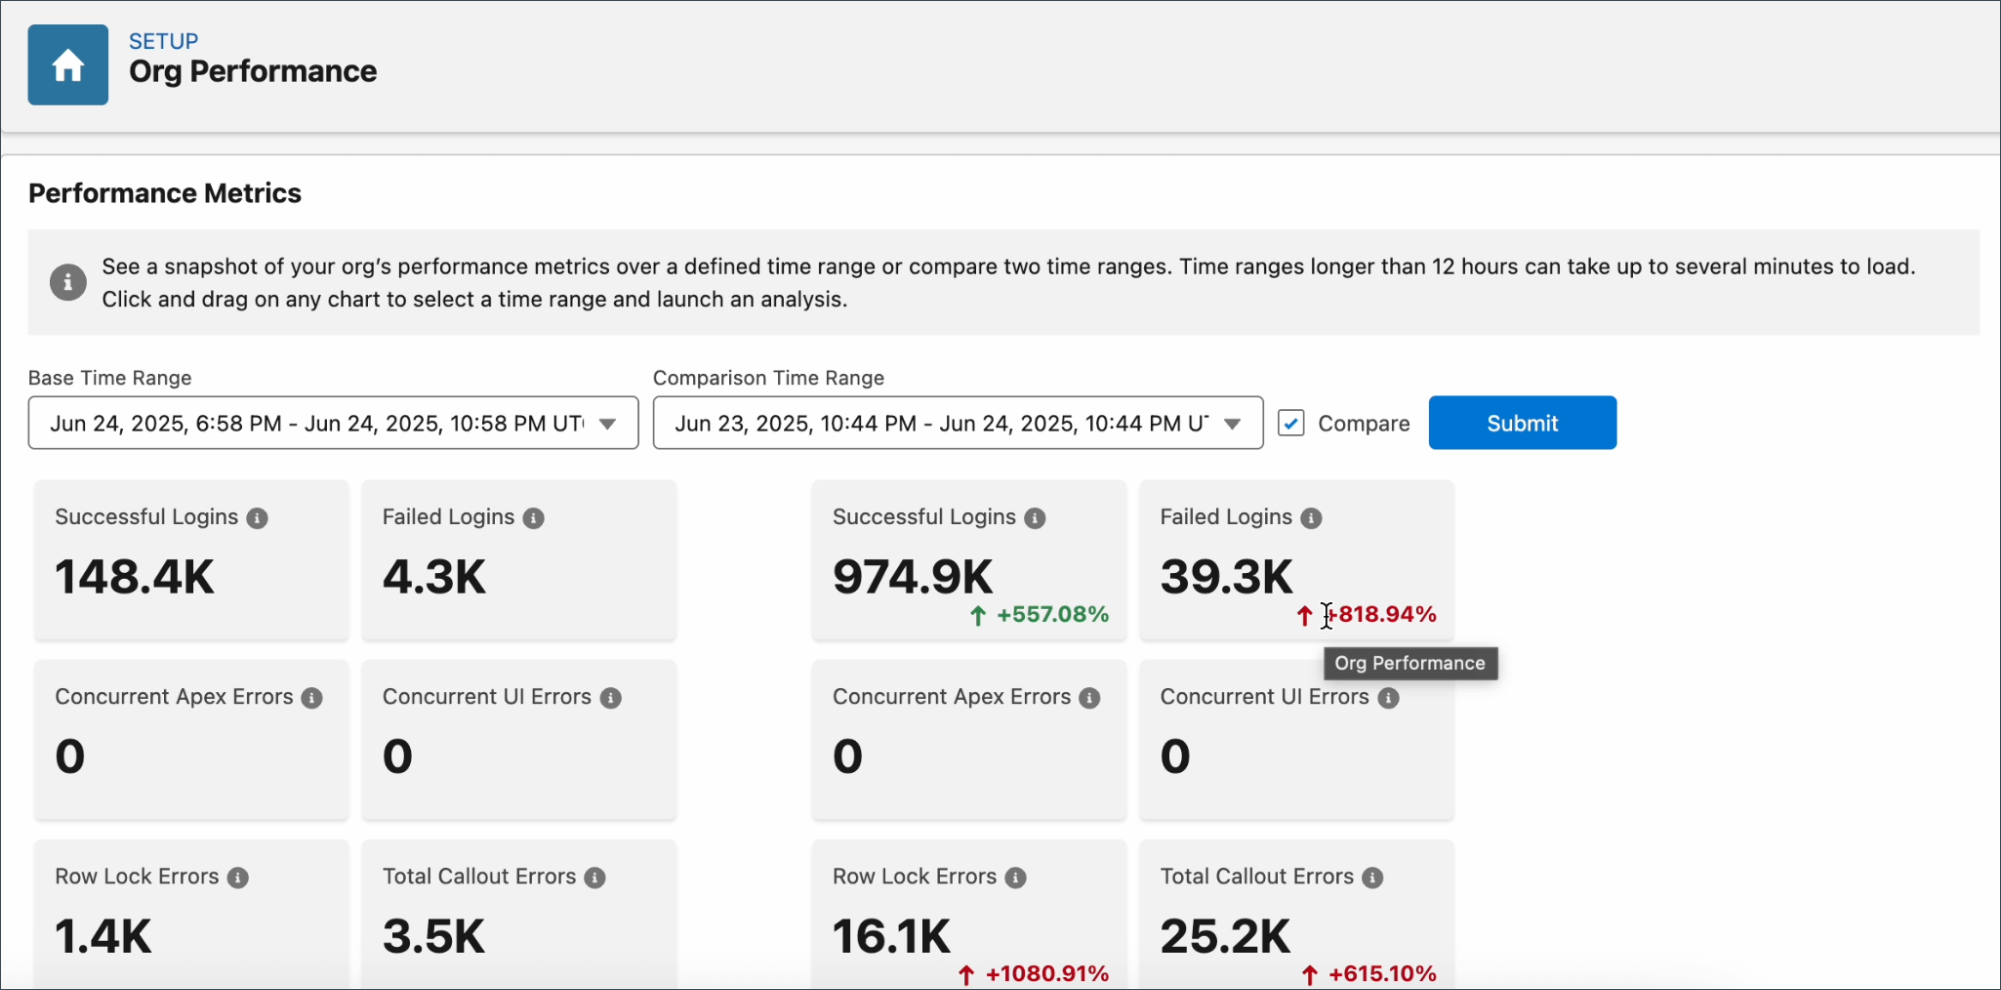
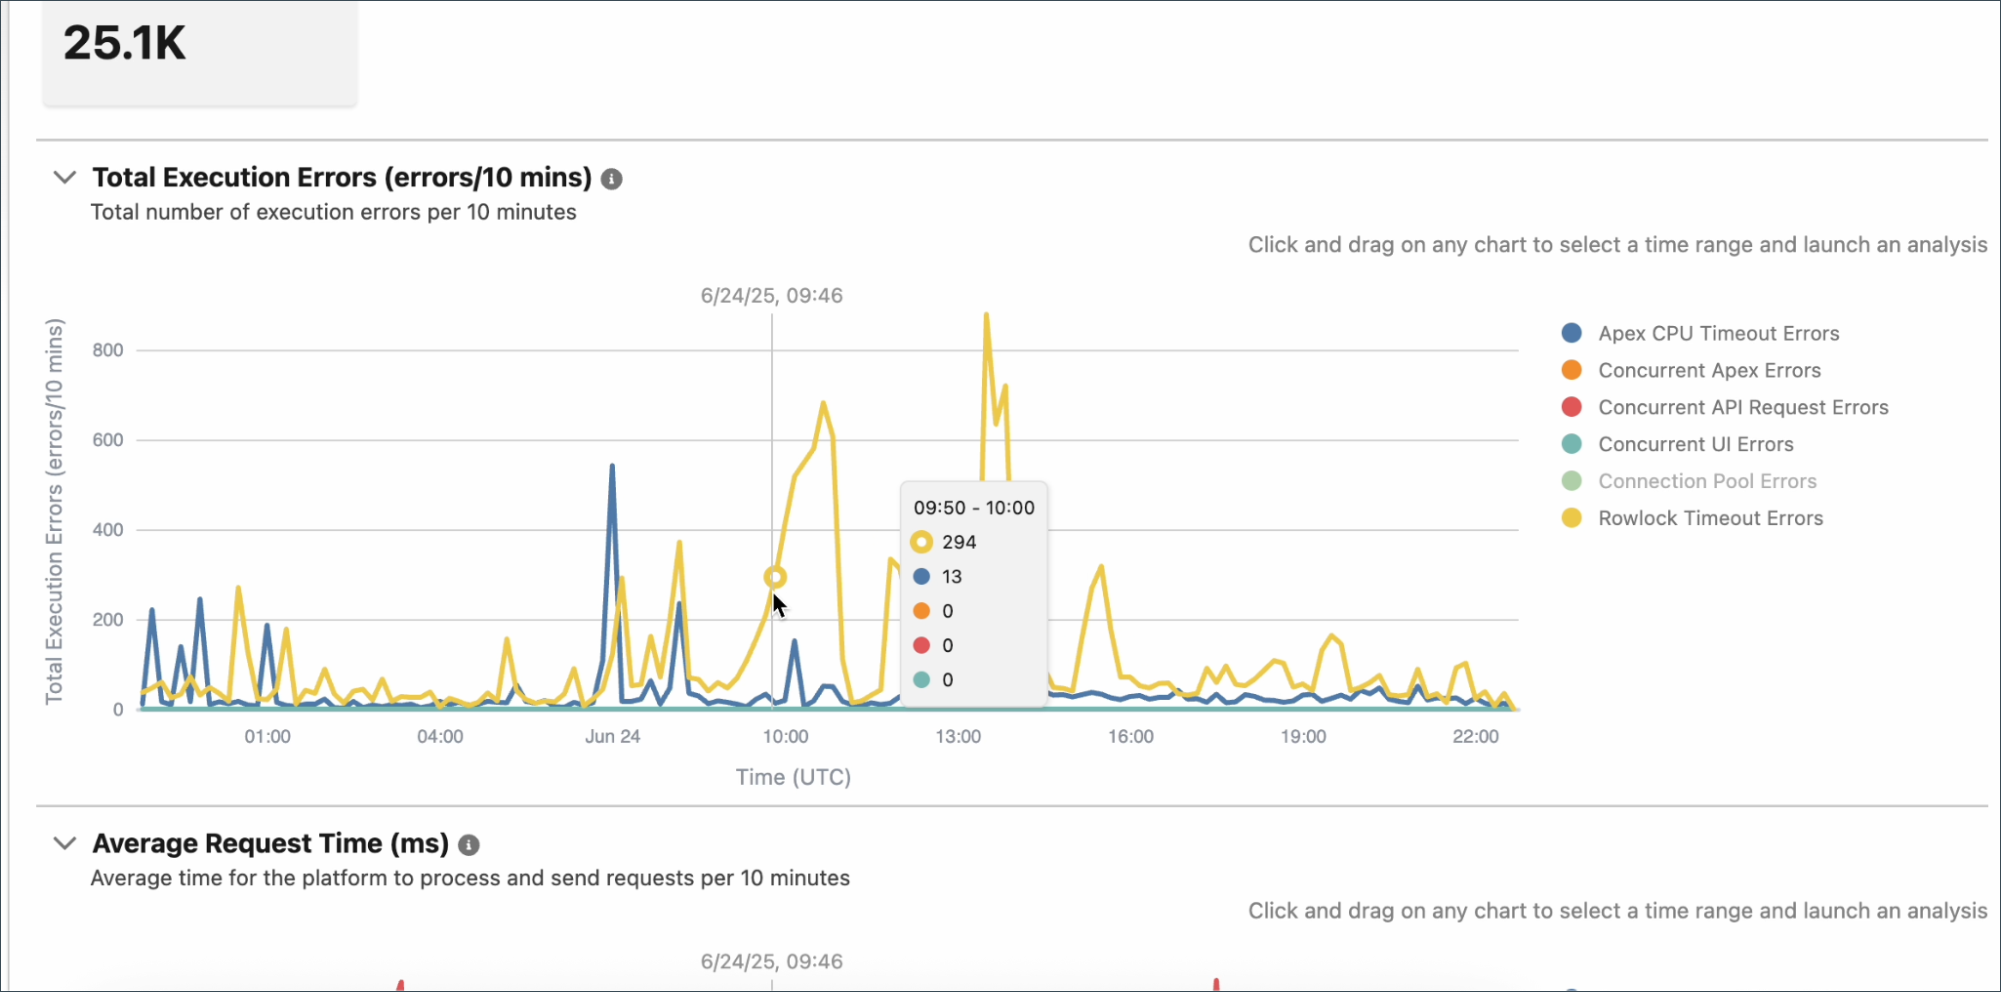
The Org Performance page serves as the primary dashboard for monitoring organizational health, presenting a unified view into critical performance indicators. According to the Scale Center documentation, the platform tracks both error conditions and general performance characteristics.
Identifies security or network issues disrupting user access
Monitors inefficient SOQL queries and high CPU consumption
Tracks failed updates from concurrent record modifications
Highlights problems with external Salesforce integrations
Mean latency experienced by end-users during transactions
Quantifies throughput processed over specified intervals
Computational resources consumed in application layer
Resources consumed by database operations
Scale Center provides sophisticated comparative analysis capabilities that enable organizations to evaluate performance across different operational contexts. The Compare feature allows users to analyze org performance metrics across two distinct time windows simultaneously, generating detailed reports that quantify how metrics have changed between comparison periods.
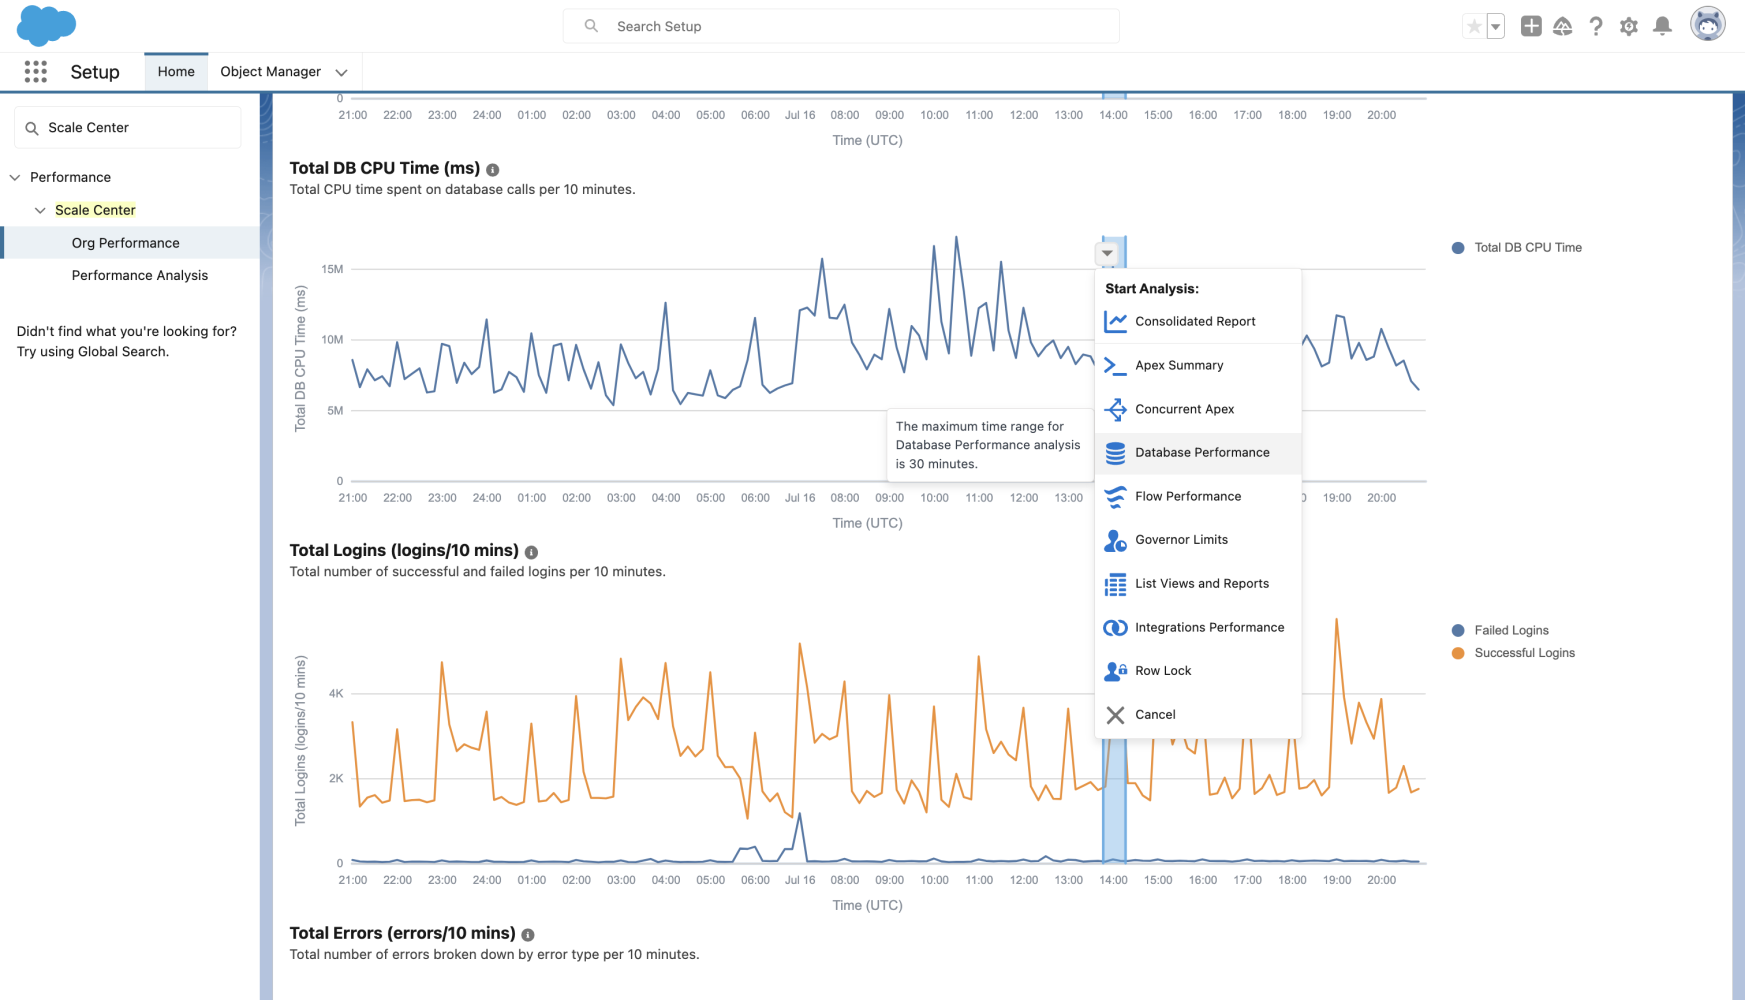
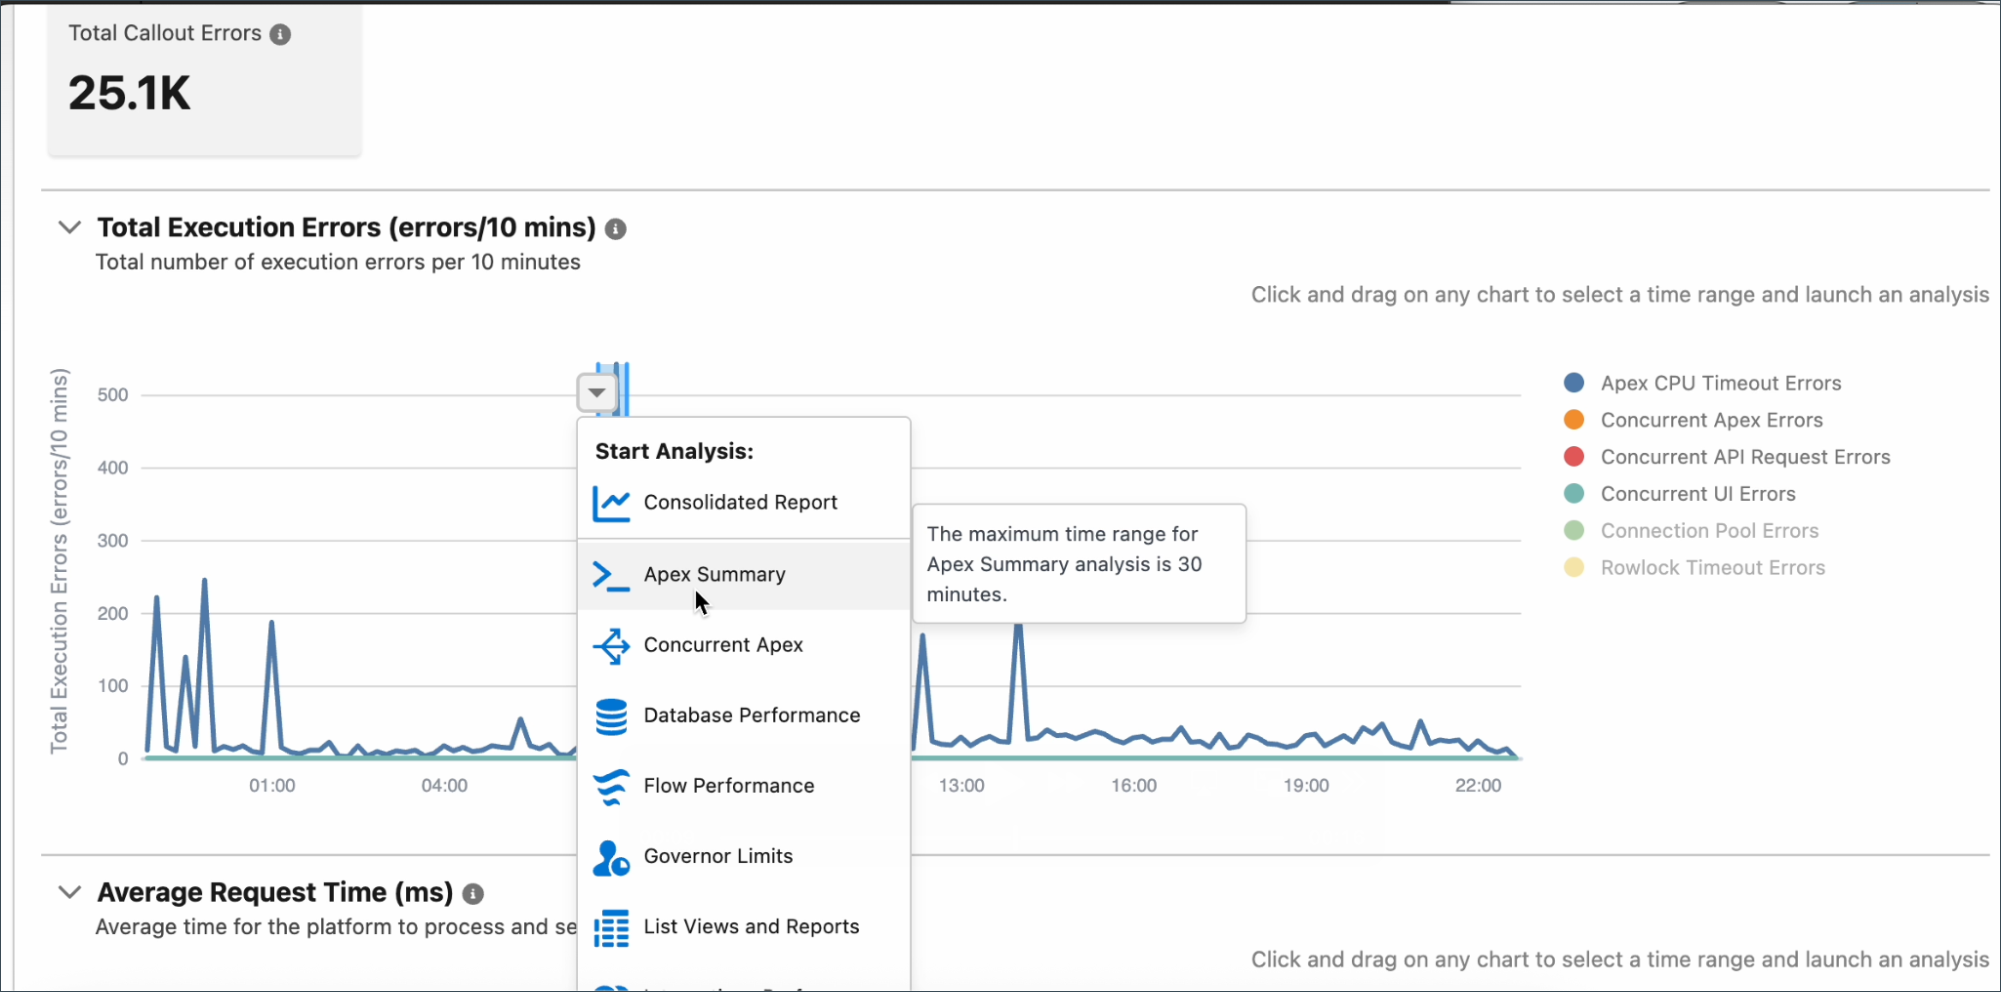
The Performance Analysis engine generates eight distinct report types, each designed to investigate specific dimensions of application performance:
| Report Type | Purpose | Key Insights |
|---|---|---|
| Consolidated Reports | Comprehensive overview combining multiple analysis types | Holistic system-wide performance perspective |
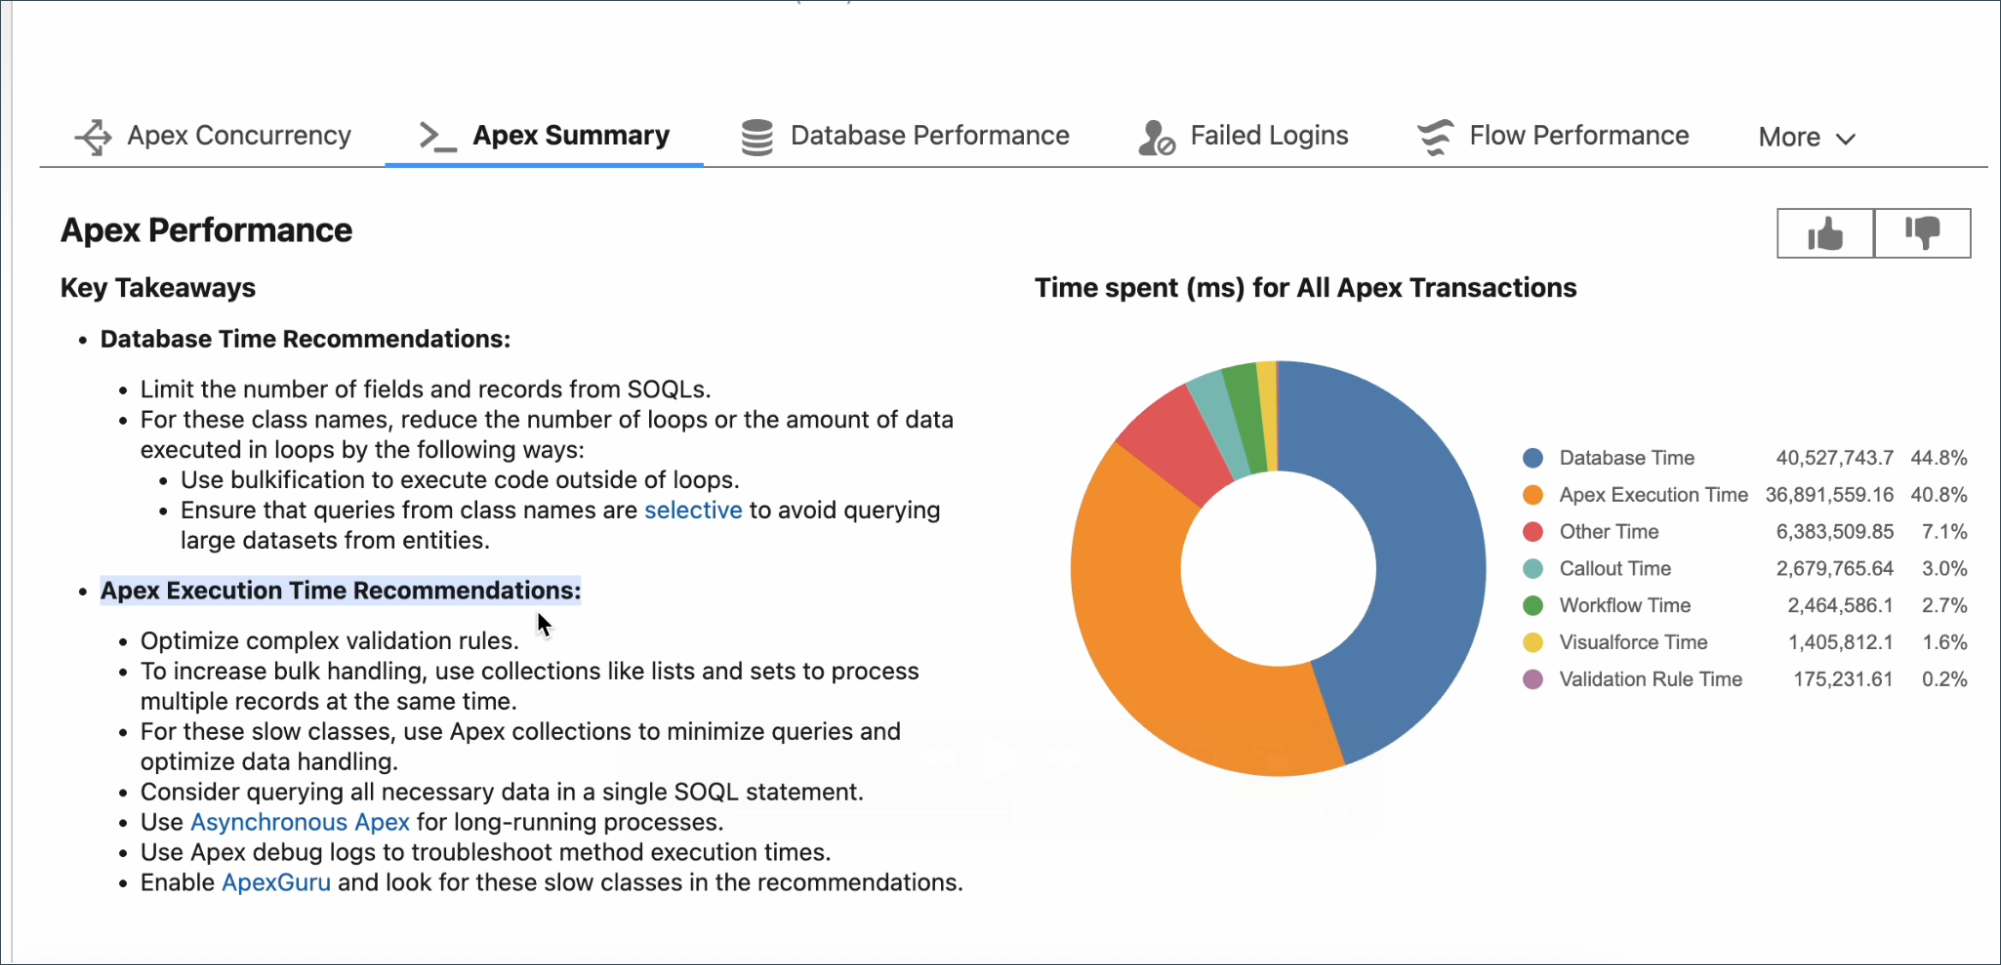
| Apex Summary | Apex code execution analysis | Classes, methods, and code paths consuming most execution time |
| Concurrent Apex | Transactions exceeding 5 seconds | Code paths violating governor limits or consuming excessive resources |
| Database Performance | SOQL and DML inefficiencies | Queries consuming most database CPU time |
| Flow Performance | Salesforce Flows and declarative automation | Performance bottlenecks in low-code/no-code components |
| Governor Limits | Transactions approaching or exceeding limits | Early warning of compliance violations |
| List Views & Reports | Saved list views and custom reports | Filter inefficiencies or data volume issues |
| Integrations Performance | Callout errors, average callout time, unencrypted URLs | Network latency or third-party service bottlenecks |
| Row Lock | Row lock errors from concurrent record updates | Identifies contention hotspots and deadlock patterns |
One of the most critical governor limits affecting Apex execution is the concurrent long-running Apex requests limit. According to the Salesforce Release Notes, this limit scales dynamically based on your organization's total license count, using specific license types that represent billable user populations.
| License Count | Concurrent Limit | Scaling Formula |
|---|---|---|
| 1 - 1,000 | 10 concurrent requests | Minimum floor - baseline for all orgs |
| 1,001 - 5,000 | 1 per 100 licenses | Example: 4,000 licenses = 40 concurrent requests |
| 5,001+ | 50 concurrent requests | Maximum cap regardless of license count |
Row lock errors occur when multiple operations attempt to modify records simultaneously. According to Salesforce Help documentation, when a record is being updated, the platform places a lock on that record to prevent concurrent modifications. Any transaction can wait a maximum of 10 seconds for a lock to be released before generating a row lock timeout error.
The distinction between Database CPU Time and Application CPU Time is fundamental to Scale Center analysis:
Enabling Scale Center in your Salesforce org is a straightforward process that requires System Administrator permissions. According to the Scale Center FAQ documentation, the platform is available in all Unlimited Edition, Enterprise Edition, and Professional Edition production and full-copy sandbox environments at no additional cost.
| Environment | Availability | Notes |
|---|---|---|
| Unlimited Edition | Available | Production and Full Copy sandboxes |
| Enterprise Edition | Available | Production and Full Copy sandboxes |
| Professional Edition | Available | Production and Full Copy sandboxes |
| Developer Sandbox | Not Supported | Limited scope/data footprint |
| Partial Copy Sandbox | Not Supported | Insufficient data volumes |
| Government Cloud Plus | Not Supported | Distinct infrastructure requirements |
| Constraint | Value | Impact |
|---|---|---|
| Data Retention | 30-day rolling window | Historical data beyond 30 days is not accessible - export reports if needed for compliance |
| Initialization Period | ~2 hours after enablement | Metrics won't appear immediately - plan enablement with lead time |
| Near Real-Time Latency | 10-12 minutes maximum | Not true real-time - slight delay before metrics reflect current state |
| Non-Admin User Limit | 5 users per org | Beyond 5 non-admin users requires workarounds |
Understanding sandbox constraints is critical for accurate performance testing. According to Salesforce sandbox documentation:
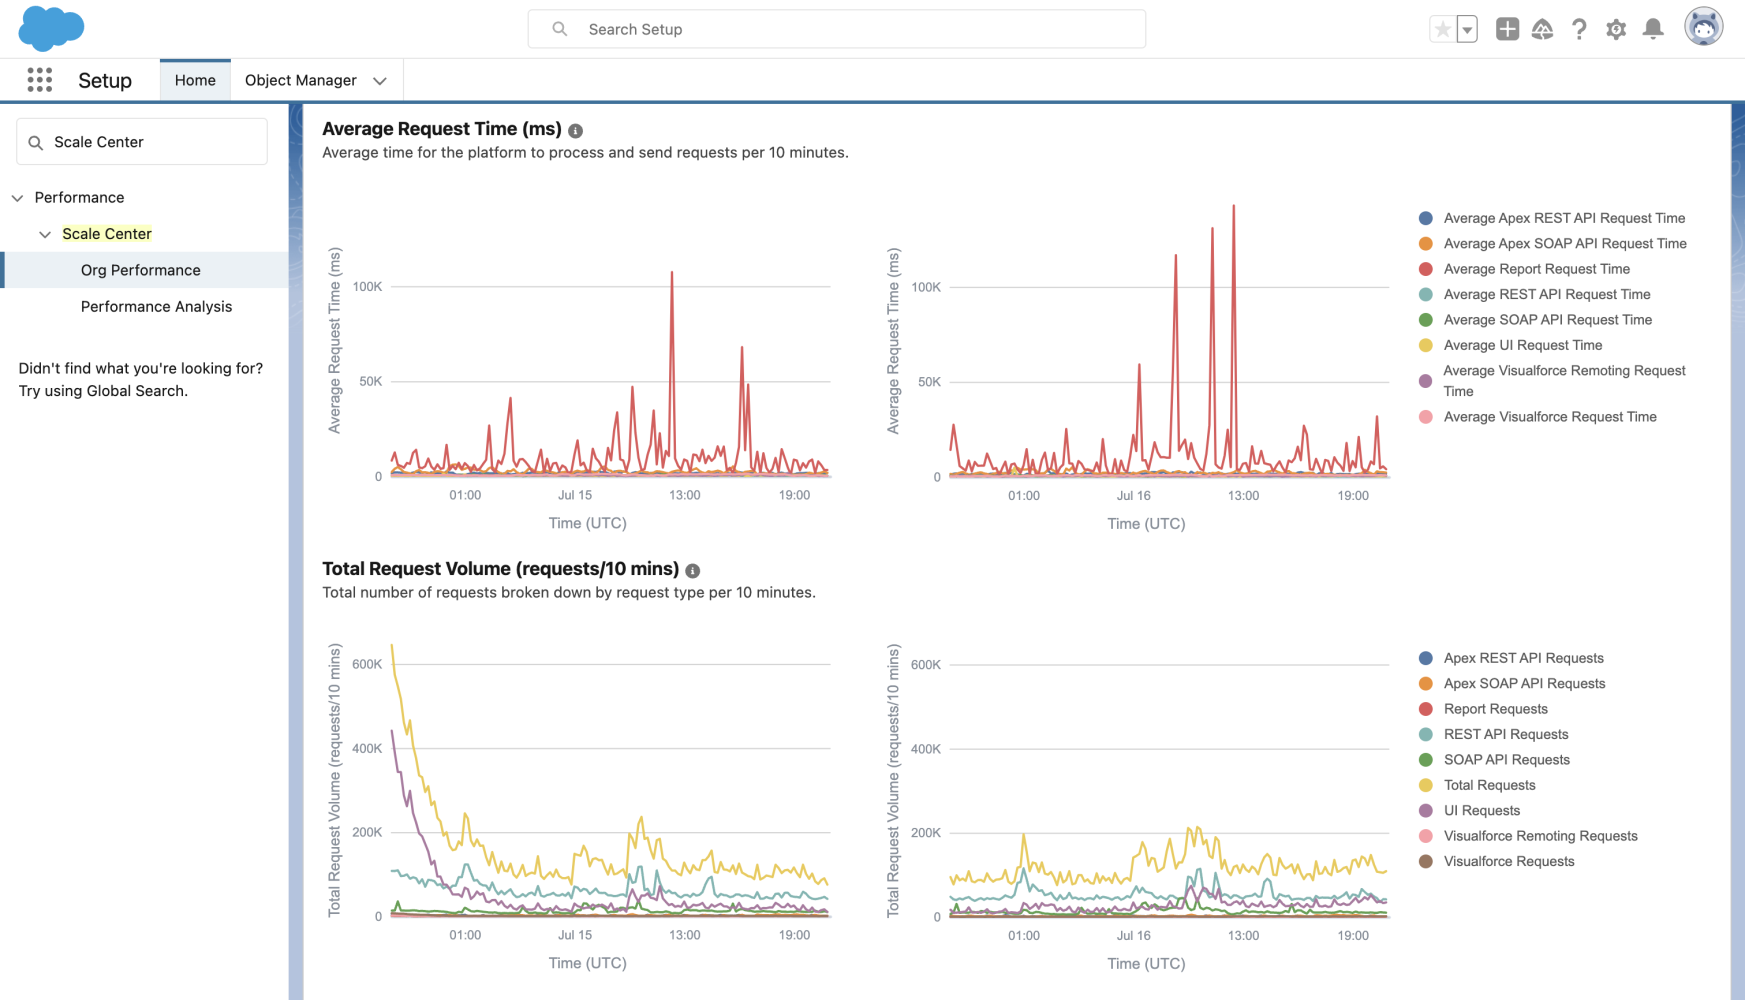
The Org Performance dashboard is the central hub for monitoring your Salesforce org's health. It provides interactive charts and metrics that update in near real-time, with approximately 10-12 minutes of latency. The dashboard stores performance data for a rolling 30-day window, enabling organizations to investigate historical incidents and track performance trends.
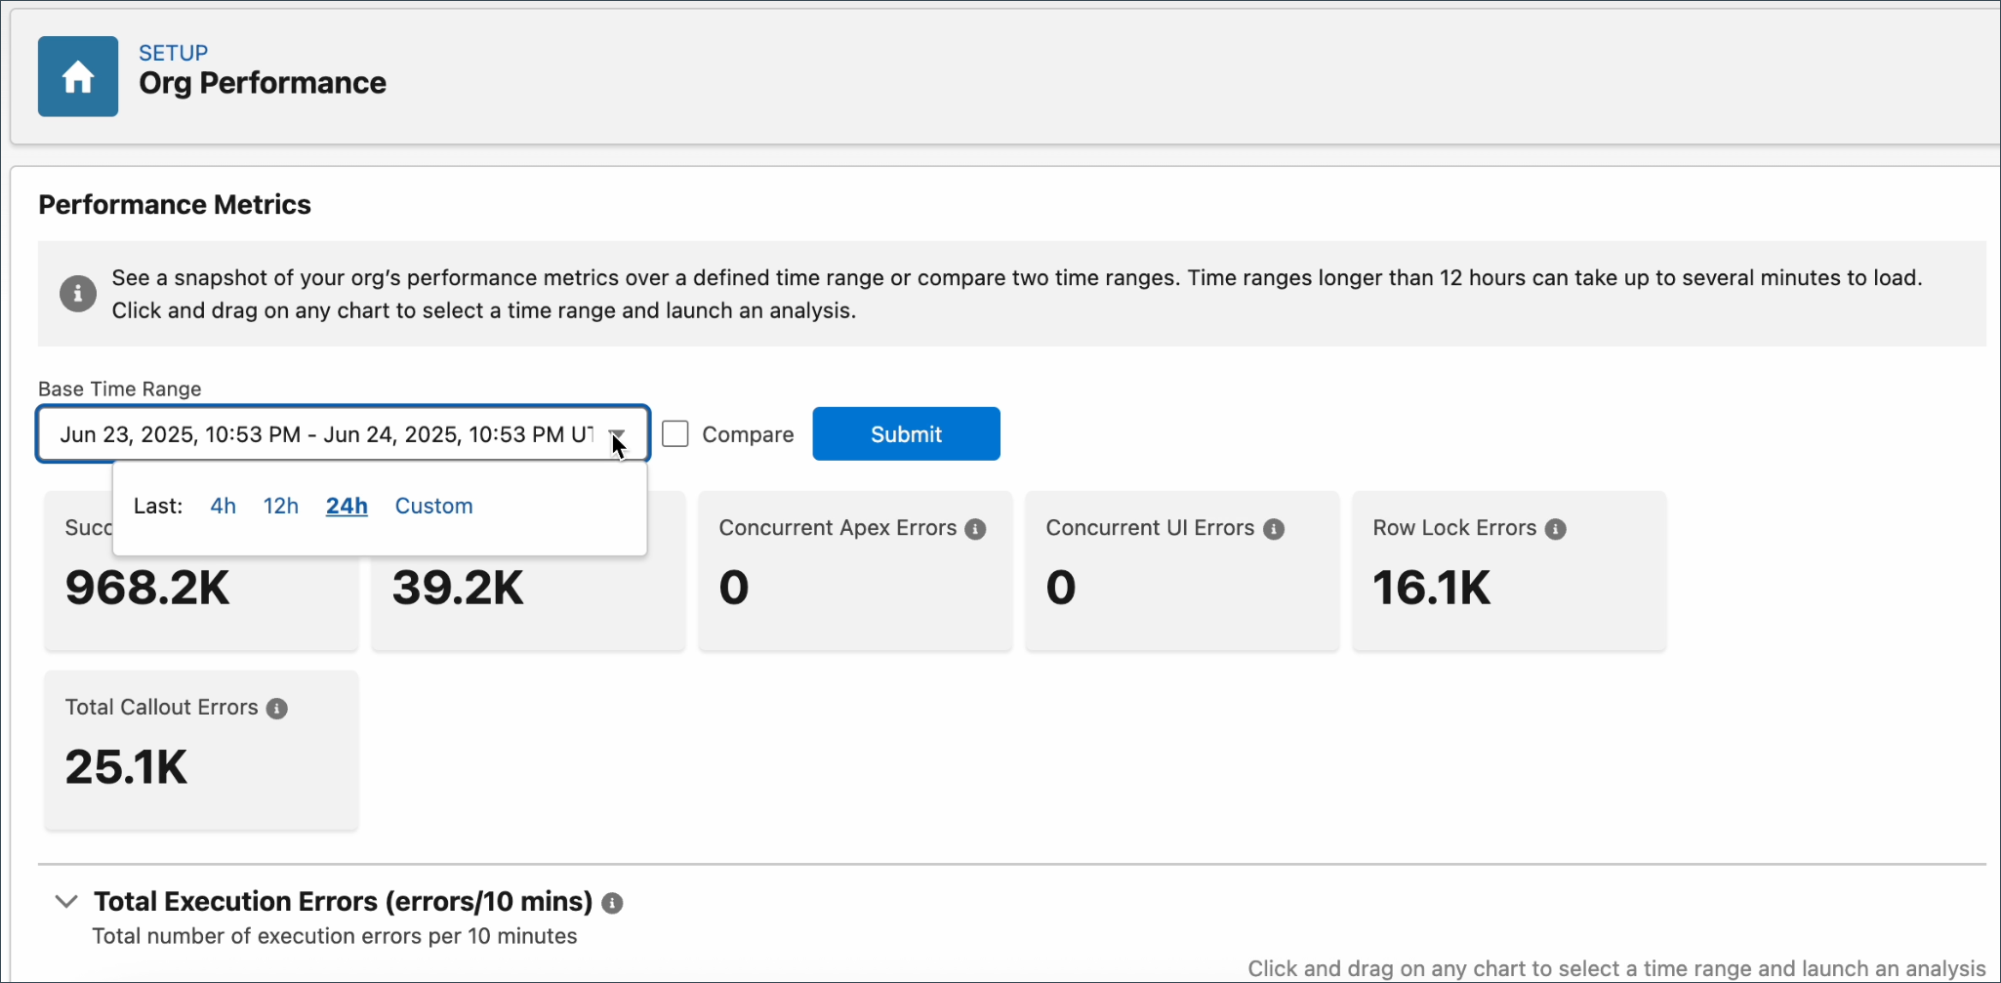
The user interface facilitates dynamic analysis through several interactive capabilities:
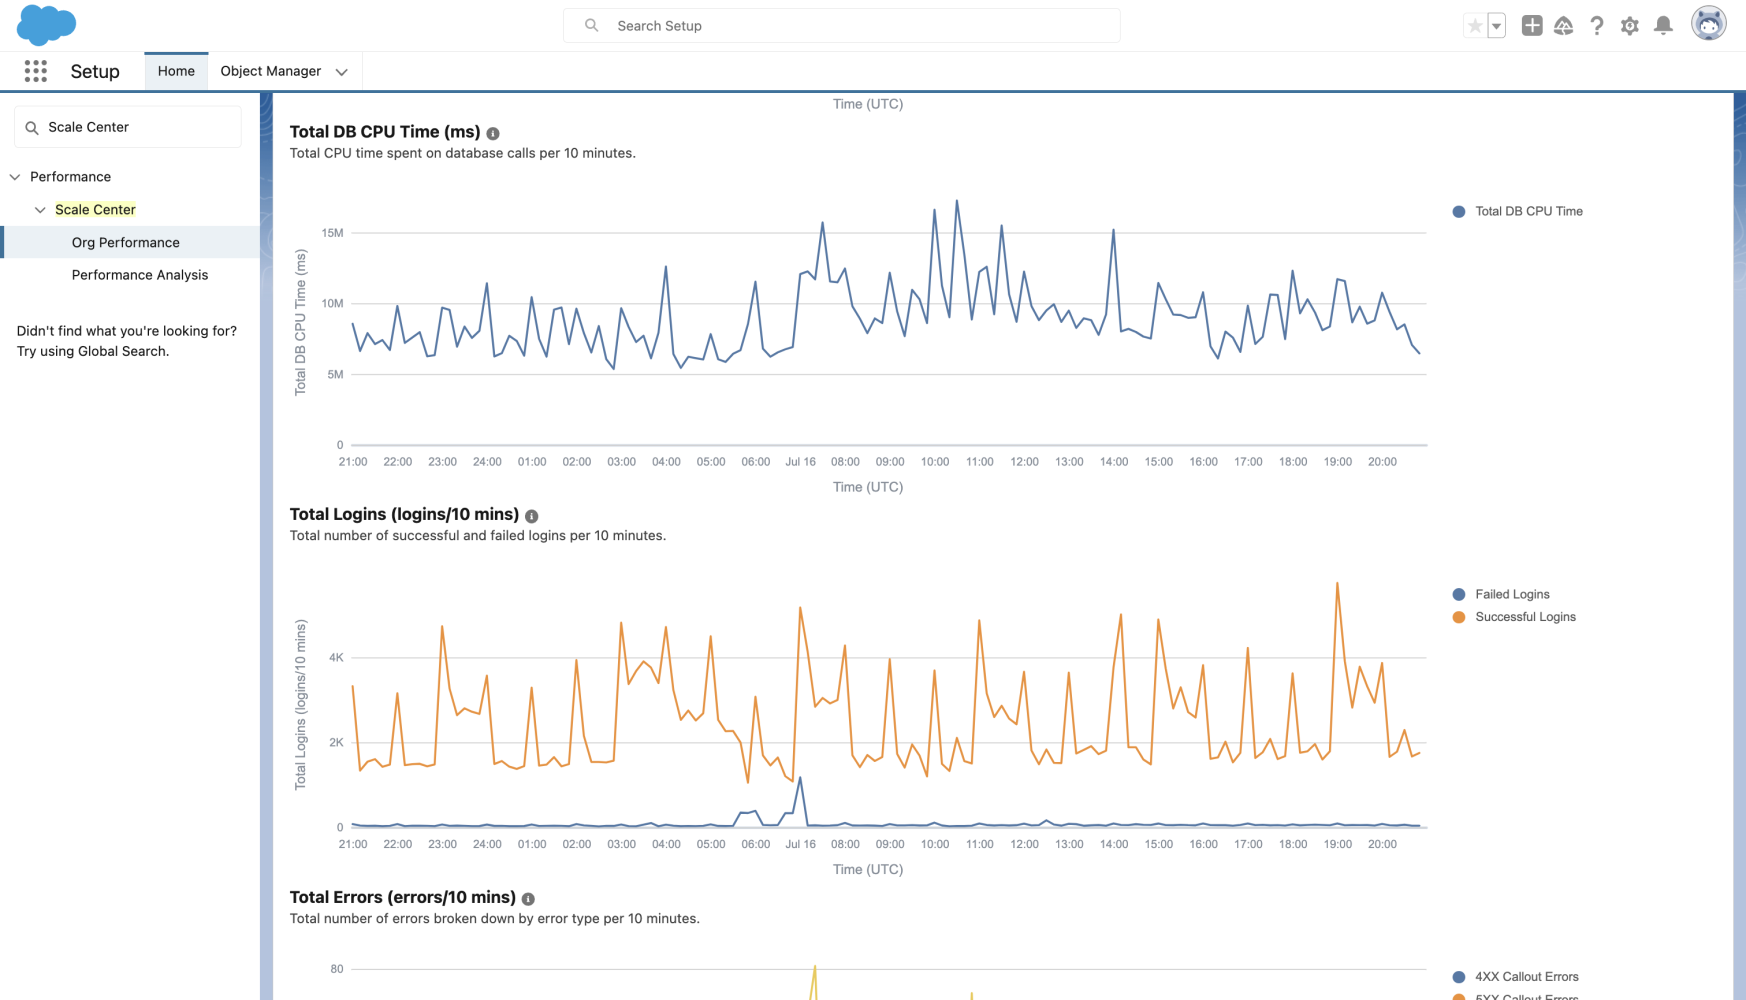
When you open performance analysis reports in Scale Center, you receive a comprehensive breakdown including top SOQL queries by database CPU time, record type activity logs, top entry points where performance anomalies originated, and users ranked by database CPU time. This multidimensional analytical view enables practitioners to quickly narrow down root causes.
Concurrent Apex errors represent one of the most challenging performance issues on the Salesforce platform. According to the Salesforce Developer Blog, these errors occur when transactions run for extended periods due to:
The Concurrent Apex report provides several analytical widgets to help diagnose issues:
Row lock errors are among the most challenging performance issues to diagnose. The Scale Center Row Lock Analysis widget helps identify the specific entities and transactions causing lock contention. Understanding the root causes is critical for effective resolution.
| Cause | Description | Resolution Strategy |
|---|---|---|
| Email-to-Case Processing | Multiple emails arriving simultaneously all try to update the same Case record, creating lock contention | Implement queueable processing or use Platform Events for asynchronous handling |
| Bulk API Operations | Bulk API jobs processing records that share parent records (e.g., Contacts under same Account) create serial lock dependencies | Group records by parent ID and process in separate batches; use Serial mode with smaller batch sizes |
| Master-Detail Rollups | Updating thousands of child records triggers rollup recalculation, locking the parent record for extended periods | Batch child updates in smaller groups; consider converting to lookup with Apex-based rollup |
| Concurrent Trigger Execution | Multiple triggers updating the same shared records (e.g., a common configuration object) compete for locks | Consolidate trigger logic; use static variables to prevent recursive updates |
| Formula Field Calculations | Cross-object formula fields on high-traffic objects extend lock duration during parent updates | Replace cross-object formulas with workflow field updates or Apex calculations |
| Sharing Recalculation | Ownership changes or sharing rule modifications trigger extensive recalculation that holds locks | Schedule sharing recalculations during off-peak hours; use Defer Sharing Calculations |
Salesforce has extended Scale Center capabilities through integration with ApexGuru, an artificial intelligence-driven code analysis tool that automates detection of performance anti-patterns. According to ApexGuru documentation, the tool provides prescriptive optimization recommendations based on machine learning models trained on extensive Apex code patterns and best practices.
Beta customers participating in the ApexGuru pilot have reported significant performance improvements:
ApexGuru's machine learning models are trained on millions of Apex code patterns and identify specific antipatterns that directly impact performance:
| Antipattern Category | Specific Detection | Impact | Typical Fix |
|---|---|---|---|
| SOQL in Loops | Queries executed inside for/while loops, including indirect calls through helper methods | Governor limit exhaustion, excessive database CPU | Pre-query collection outside loop, use Maps for lookups |
| DML in Loops | Insert/update/delete statements inside iteration blocks | Governor limit hits, transaction timeouts | Collect records in List, perform single bulk DML |
| Non-Selective Queries | SOQL without WHERE clause or filtering on non-indexed fields on large objects | Full table scans, query timeouts | Add indexed field filters, request custom indexes |
| Unused Apex Methods | Methods that exist in code but are never invoked in production | Code bloat, maintenance overhead, deployment delays | Remove dead code after verification |
| Unused Apex Classes | Entire classes with no runtime invocations detected | Compilation time, org complexity | Archive or delete after confirming obsolescence |
| Inefficient String Operations | String concatenation in loops instead of StringBuilder patterns | Heap memory consumption, CPU time | Use List<String>.join() or StringBuilder equivalent |
| Recursive Trigger Patterns | Triggers that can re-invoke themselves through indirect DML | Unexpected governor limit consumption, logic errors | Implement static recursion guards |
| Excessive SOQL Fields | SELECT * equivalent patterns retrieving unused fields | Heap consumption, network overhead | Select only required fields |
While Scale Center and Scale Test are complementary tools in Salesforce's performance toolkit, they serve distinct purposes. Understanding when to use each is critical for effective performance management. According to the Scale Test documentation, the two tools address different phases of the application lifecycle.
| Aspect | Scale Center | Scale Test |
|---|---|---|
| Purpose | Monitors and analyzes production/sandbox performance in near real-time | High-load sandbox testing simulating production peak traffic |
| Cost | Free (included with qualifying editions) | Paid add-on |
| Environment | Production and Full Copy sandboxes | Hyperforce Full Copy sandboxes only |
| Traffic Volume | Monitors actual user traffic | Simulates 120+ requests per second |
| Primary Use | Ongoing monitoring, post-deployment analysis, troubleshooting | Pre-live validation for major rollouts or peak events |
| Access | Setup > Scale Center (enable toggle) | Setup > Scale Test (book slots via AE) |
| Output | Actionable insights and recommendations | Performance metrics checklist with "Open in Scale Center" link |
Effective Scale Center utilization requires adoption of disciplined practices and methodologies that establish baselines, enable continuous monitoring, and translate performance insights into targeted optimization initiatives. Based on guidance from performance testing experts and official Salesforce documentation, here are the key best practices:
Organizations should establish clear performance baselines during stable operational periods when known user loads are being processed. These baseline metrics serve as reference points for evaluating whether subsequent performance anomalies represent genuine problems or normal variation.
Rather than relying on ad hoc analysis triggered only when users report performance issues, establish regular monitoring cadences aligned with your business operations and development cycles:
When Scale Center identifies performance anomalies, prioritize thorough root cause analysis over surface-level remediation. A performance spike in Average Request Time might stem from:
Each root cause demands different remediation strategies. Use Scale Center's deep analysis capabilities to identify the specific root cause before implementing fixes.
Scale Center analysis is most powerful when performance metrics are correlated with specific business events and technical changes. When analyzing performance spikes, investigate:
Whenever significant code changes, configuration modifications, or infrastructure changes are deployed to production, conduct Scale Center analysis comparing pre-change and post-change performance metrics. This regression testing discipline ensures that changes do not introduce unexpected performance consequences.
Organizations with Signature Success support plans have access to enhanced Scale Center capabilities through proactive monitoring services:
| Feature | Standard | Signature Success |
|---|---|---|
| Automated Alert Monitoring | Manual review required | Salesforce TAMs proactively monitor and alert on anomalies |
| Performance Reviews | Self-service analysis | Quarterly performance reviews with dedicated technical architect |
| Optimization Guidance | In-product recommendations | Personalized optimization roadmap with implementation support |
| Incident Correlation | Customer-driven investigation | Salesforce-led correlation with platform incidents |
A common misconception is that all "green" metrics in Scale Center indicate optimal performance. However, green status simply means you're within governor limits, not that your implementation is optimized:
Scale Center demonstrates value across diverse scenarios spanning the entire application lifecycle. Here are the most common use cases where organizations leverage Scale Center for maximum impact:
Organizations conduct comprehensive performance testing in full-copy sandbox environments that replicate production data volumes. Upon completion of testing, teams import performance data into Scale Center and analyze how the application performed under controlled test load. This analysis identifies specific performance bottlenecks before promoting changes to production.
After major releases or significant feature deployments, Scale Center enables direct comparative analysis of organizational performance before and after the deployment. This approach enables teams to rapidly determine whether the deployment introduced any performance regressions and develop remediation strategies if needed.
Organizations experiencing seasonal demand patterns benefit from Scale Center's ability to isolate and analyze performance during peak periods. By comparing peak-period metrics to baseline behavior during normal usage, organizations can identify scaling limitations and proactively optimize before the next peak season.
Beyond discrete deployment events, Scale Center serves as the foundation for ongoing organizational performance management:
Capture metrics before and after new integrations to measure impact on system performance
Conduct regression testing when Salesforce releases new platform versions
Use Apex Summary reports to prioritize code optimization efforts on high-impact areas
Identify whether issues originate from Salesforce code or external services
Understanding Scale Center's limitations and common pitfalls helps you extract maximum value from the platform. Here are critical considerations that experienced practitioners should know:
| Issue | Cause | Solution |
|---|---|---|
| "No data available" after enabling | Scale Center requires a 2-hour initialization period after first enablement | Wait 2+ hours; check back during the next business day for meaningful data |
| Gaps in time series data | 10-12 minute latency between transaction execution and metric availability | Account for near-real-time delay when troubleshooting live issues |
| Missing historical data | 30-day rolling retention window; older data automatically purged | Export critical reports regularly; establish external archival processes |
| Sandbox data not appearing | Partial Copy sandboxes have limited Scale Center functionality due to 5GB/10K record limits | Use Full Copy sandbox for comprehensive testing; Partial Copy only for lightweight validation |
| Metrics missing for specific transactions | Very fast transactions (under threshold) may not be individually captured | Focus on aggregate patterns rather than individual transaction traces |
| Symptom | Likely Cause | Resolution |
|---|---|---|
| Scale Center not visible in Setup | Org edition doesn't include Scale Center (Developer Edition, Group Edition) | Upgrade to Professional, Enterprise, or Unlimited Edition |
| Can see Scale Center but no data | User lacks View Setup and Configuration permission | Assign System Administrator profile or custom permission set with required access |
| "Maximum users reached" error | 5 concurrent user limit for Scale Center access exceeded | Coordinate access; users should close Scale Center when not actively using it |
| Government Cloud access issues | Government Cloud Plus (FedRAMP High/IL4) not supported | No workaround; Scale Center is unavailable for GovCloud Plus environments |
Salesforce has announced significant enhancements to Scale Center throughout 2025 and into 2026. According to the Salesforce Admin Blog, these updates reflect ongoing investment in performance optimization capabilities.
Salesforce has announced plans for continued Scale Center expansion:
Salesforce Scale Center is a self-serve performance monitoring platform that provides near real-time access to org performance metrics. It enables developers, architects, and administrators to diagnose root causes of performance issues, validate performance test results, and prevent poor-performing code from being deployed to production through a shift-left methodology.
Yes, Scale Center is completely free to use. It is available at no additional cost in all Unlimited Edition, Enterprise Edition, and Professional Edition production orgs and full-copy sandbox environments. There are no additional licensing fees or per-user costs for Scale Center.
Scale Center is a free monitoring and analysis tool that provides real-time performance insights for production and sandbox environments. Scale Test is a paid add-on designed for high-load testing that simulates production-level traffic (over 120 requests per second) in sandbox environments with upgraded infrastructure. Scale Center is for ongoing monitoring; Scale Test is for pre-launch load testing.
To enable Scale Center: 1) Navigate to Setup, 2) Search for "Scale Center" in Quick Find, 3) Toggle the "Enable Scale Center" switch. After enabling, wait approximately 2 hours for initial data collection before meaningful metrics become available. System Administrators automatically have access.
ApexGuru is an AI-driven code analysis tool integrated with Scale Center that automatically detects performance anti-patterns in Apex code. It analyzes runtime profiles to identify critical issues like SOQL/DML anti-patterns, provides prescriptive optimization recommendations with specific line-of-code references, and has helped beta customers achieve 20% overall App CPU savings on average.
Salesforce enforces a 10-second row lock timeout. If a transaction waits more than 10 seconds to acquire a lock on a row that's locked by another transaction, the waiting transaction fails with a "UNABLE_TO_LOCK_ROW" error. Scale Center's Row Lock Analysis widget helps identify which records and transactions are causing lock contention.
The concurrent long-running Apex limit restricts how many Apex transactions running longer than 10 minutes (or 5 seconds for synchronous) can execute simultaneously. The limit is calculated based on licenses: for orgs with 1,000-5,000 licenses, the limit equals (number of licenses ÷ 100), with a minimum of 10. For orgs with 5,000+ licenses, the limit is capped at 50. Scale Center reports on transactions approaching this limit.
Scale Center retains performance data for a 30-day rolling window. Data older than 30 days is automatically purged and cannot be recovered. Organizations requiring longer retention should establish external archival processes by regularly exporting critical reports and metrics to external storage systems.
Database CPU Time measures time spent executing database operations (SOQL queries, DML statements). Application CPU Time measures time spent in Apex code execution. High Database CPU suggests query optimization needs (indexes, selective filters). High Application CPU suggests code optimization needs (algorithm efficiency, loop reduction). Scale Center helps you distinguish between these to focus optimization efforts correctly.
Scale Center is available in Partial Copy sandboxes but with significant limitations. Partial Copy sandboxes are limited to 5GB of data and 10,000 records per object, which may not accurately represent production performance patterns. For comprehensive performance testing, Full Copy sandboxes are recommended as they replicate production data volumes more accurately.
Reference guide for technical terms and abbreviations used throughout this article.
Explore more Salesforce guides and best practices on Jitendra's Blog:
