Unity Catalog Is Not a Web App Database: Why Our Databricks App Moved to PostgreSQL
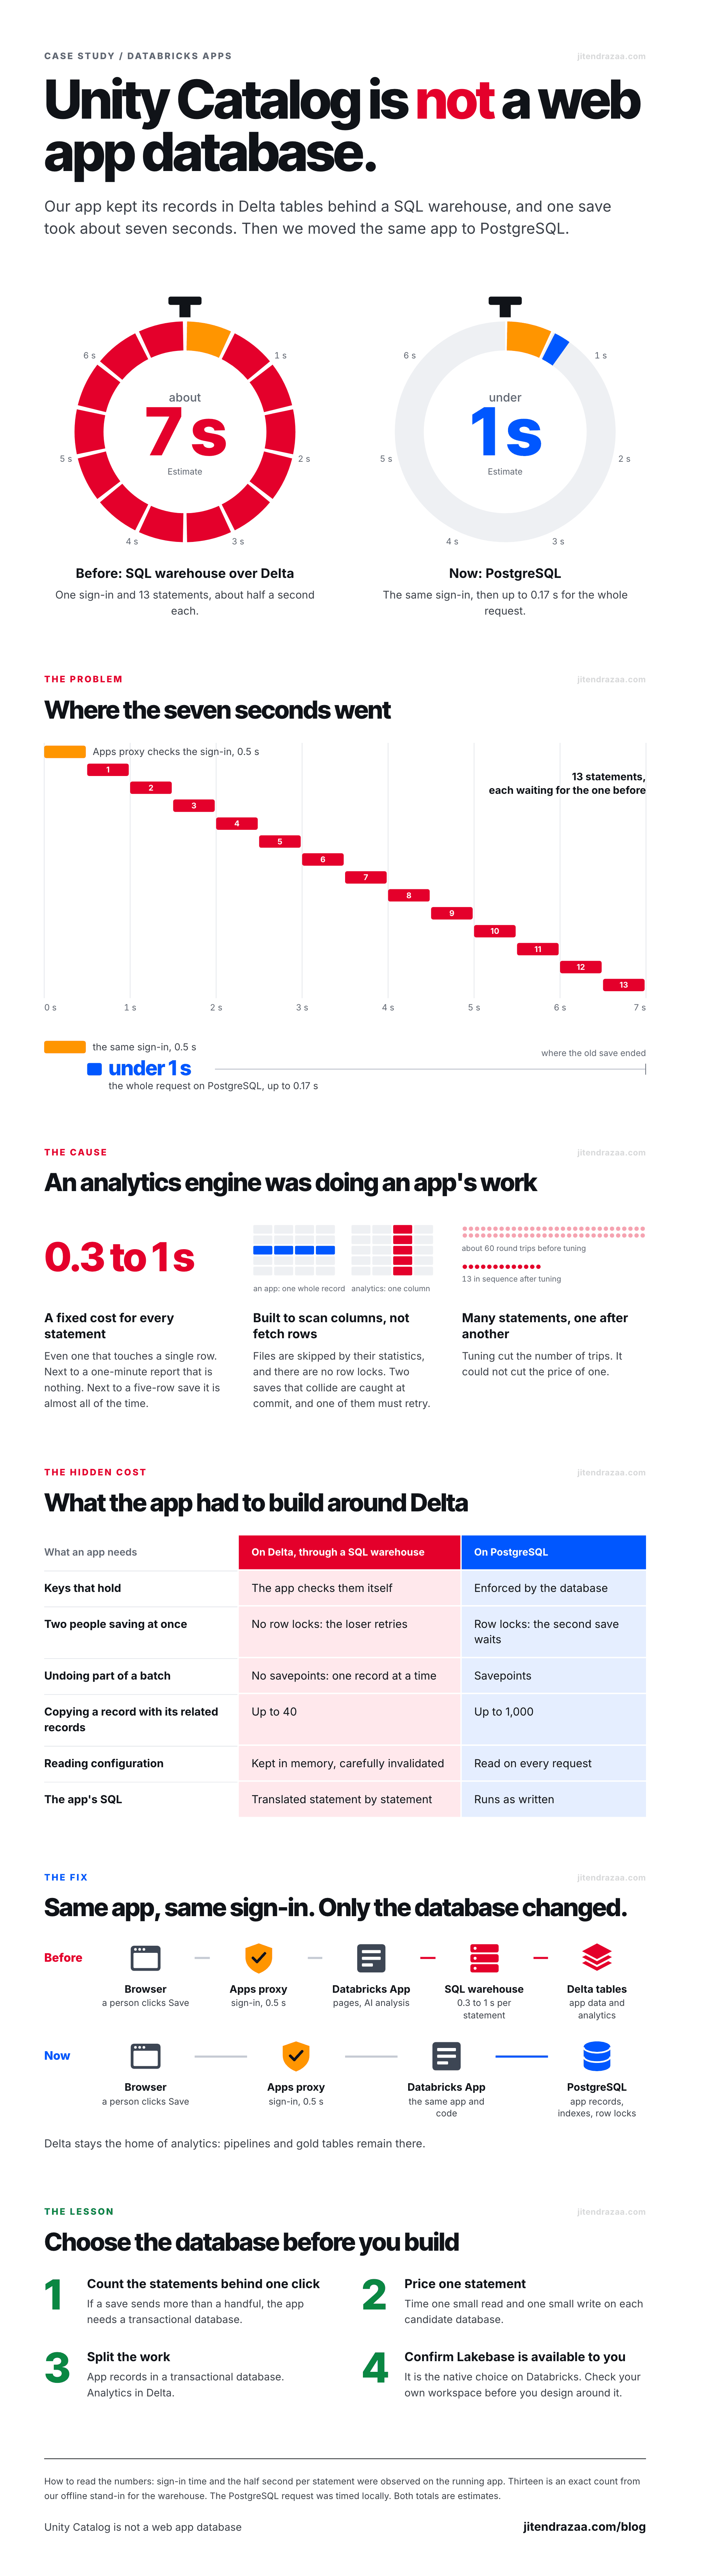
Our Databricks App kept its records in Unity Catalog Delta tables behind a SQL warehouse, and one save took about 7 seconds. We moved the same app to PostgreSQL and it became drastically faster. Here is what we measured, what tuning could not fix, and why Lakebase was not an option for us.
01 The short answer
We run a web application that analyzes incoming email and performs AI analysis on it: how confident we are about the sender's intent, and which evidence supports it. It runs as a Databricks App. Until recently, every page and every save went through a SQL warehouse to Delta tables in Unity Catalog.
Unity Catalog itself is a governance layer for data and AI assets. In this post, "Unity Catalog as a database" means what our app actually used: Delta tables governed by Unity Catalog and queried through a SQL warehouse. That combination is built for analytics. It is not built for a web application that saves records all day.
The app was written for PostgreSQL first. On the warehouse, saving one record took about 7 seconds, even after several rounds of tuning (Estimate). We then moved the app's data to a PostgreSQL server. Nothing else changed: the same code, the same Databricks App, the same sign-in. The app became drastically faster (Observed). Only the database changed, and that is the whole lesson of this post.
02 The basics, in plain words
Databricks is a cloud platform for analytics and AI, and the pieces it is made of explain everything that follows. This section covers what the platform is, what it is normally used for, and the seven pieces our app touched on every save. If you already work with Databricks, skip to the next section.
What Databricks is
In its own words, Databricks is "a unified, open analytics platform for building, deploying, sharing, and maintaining enterprise-grade data, analytics, and AI solutions at scale". In plain words, it is a service where a company brings its data together, cleans it, and uses it for reports, dashboards and machine learning.
It runs on AWS, Microsoft Azure and Google Cloud. The platform "integrates with cloud storage and security in your cloud account", so in the usual setup the data stays as files in the company's own cloud storage, and Databricks supplies the engines that work on those files. Azure Databricks is the same platform offered on Microsoft Azure, and it is where our app runs.
Two ideas carry most of the weight:
- Workspace
- "A workspace is an environment for accessing all of your Databricks assets." It is where a team signs in and finds its notebooks, dashboards, data and compute.
- Storage and compute are separate
- The data rests in storage. Compute is the machines that read and change it, and Databricks' lakehouse page describes an engine "that runs on compute resources decoupled from storage". A SQL warehouse is one kind of compute: "a computation resource on which you run SQL queries".
Where things are in a workspace
This is what a workspace looks like when you sign in. The screenshots in this section come from Databricks' own documentation as published in October 2026. The orange boxes and numbers are ours.
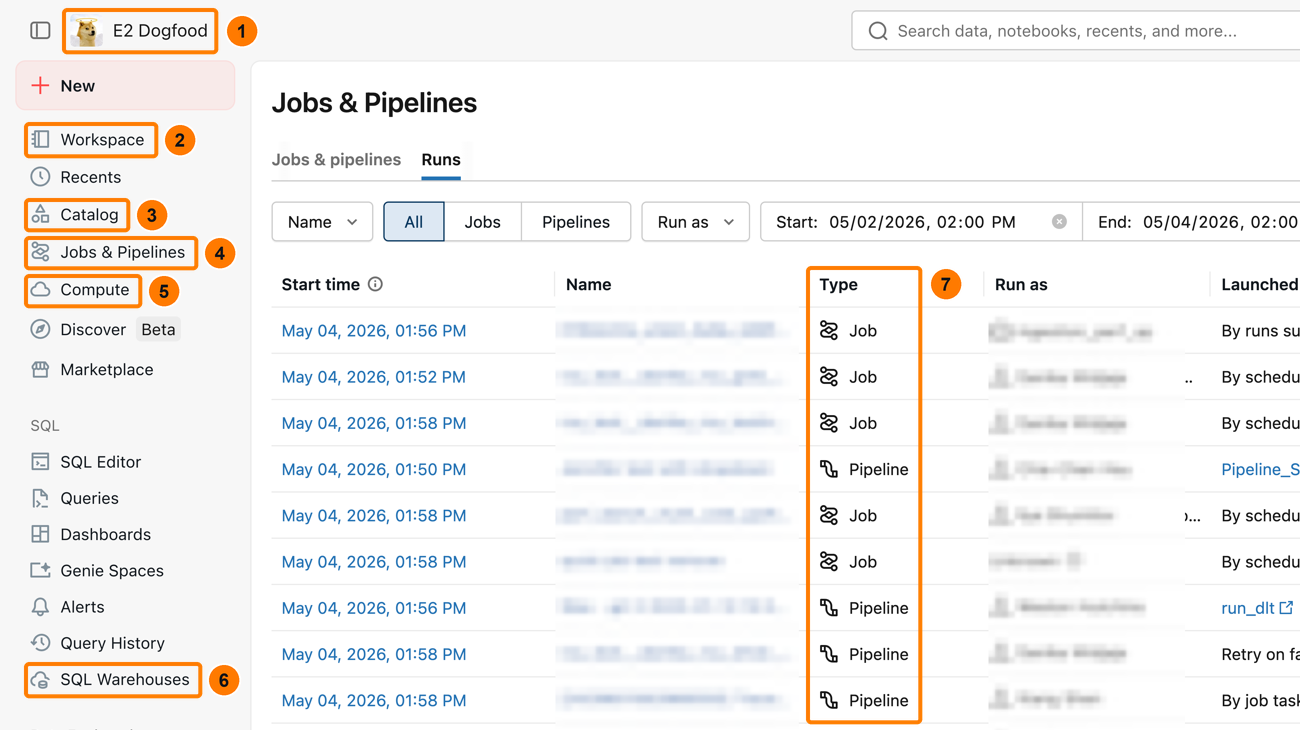
- Workspace name. The top bar shows which workspace you are in.
- Workspace. The workspace browser, where you "create, browse, and organize Databricks objects" such as notebooks and dashboards.
- Catalog. Opens Catalog Explorer, the screen for browsing what Unity Catalog governs: catalogs, schemas and tables.
- Jobs & Pipelines. The jobs and pipelines that load and reshape data. The page on the right is the list of their runs.
- Compute. The clusters that run notebooks and jobs.
- SQL Warehouses. The compute that runs SQL. Our app sent every statement to one of these.
- Type. Every run in the list is a job or a pipeline. This is the work the platform is built around.
What it is normally used for
Most work on Databricks moves data in one direction: from raw to ready for a report. Databricks calls the usual pattern the medallion architecture, "a series of data layers that denote the quality of data stored in the lakehouse".
The bronze layer "contains raw, unvalidated data". The silver layer "represents validated, cleaned, and enriched versions of the data". The gold layer "represents highly refined views of the data that drive downstream analytics, dashboards, ML, and applications". A pipeline is the code that moves data from one layer to the next. When this post says "pipelines and gold tables", this is what it means.
Notice the shape of that work: a few large jobs, each reading and writing many rows at a time, with nobody waiting on a single row. A web application has the opposite shape: many tiny reads and writes of single records, each with a person waiting for it. Section 04 explains why one engine is not good at both.
The seven pieces behind one save
Seven pieces sit between a click on Save and the files that hold the data: the browser, the Apps proxy, the Databricks App, a SQL warehouse, Unity Catalog, a Delta table and cloud object storage.
Two of those pieces are easy to picture once you have seen them. The first is the page Databricks shows for an app.
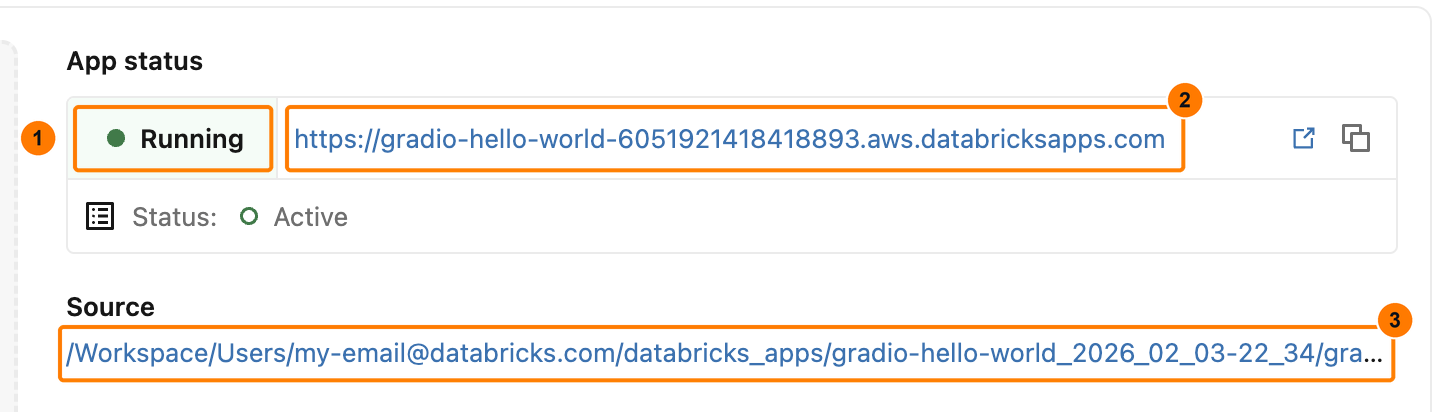
- Status. The app is running. It is a web server hosted by Databricks.
- The app's web address. People open this in a browser. The Apps proxy checks their sign-in before the request reaches the app.
- Source. The app's code, in a folder of the workspace.
The second is a SQL warehouse at work. A warehouse's Monitoring tab lists the statements it ran.
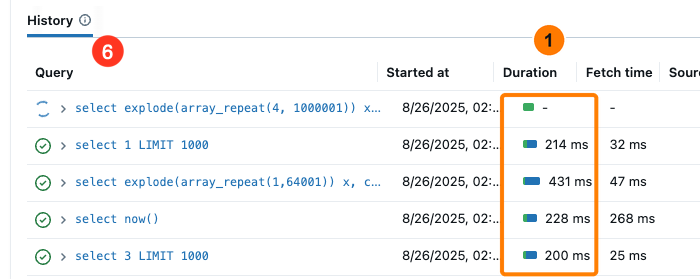
- Duration. In Databricks' own example,
select 1 LIMIT 1000takes 214 ms andselect now()takes 228 ms. Neither reads a table. This is one screenshot, not a benchmark, but it is the per-statement cost that section 04 is about.
The terms
- Lakehouse
- Databricks describes a data lakehouse as "a data management system that combines the benefits of data lakes and data warehouses". The data sits as files in cloud object storage, and the platform is built for work such as business intelligence and machine learning.
- Unity Catalog
- Unity Catalog is "the unified governance layer for data and AI built into Databricks". It is the list of what exists and the rules for who may use it. It is not a storage engine.
- Delta table
- Delta Lake "extends Parquet data files with a file-based transaction log for ACID transactions". It is the default table format on Databricks.
- SQL warehouse
- A compute resource that runs SQL against those tables. The app never reads a Delta file directly; it asks the warehouse.
- Databricks App
- Databricks Apps "enables developers to build and deploy secure data and AI applications directly on the Databricks platform".
- Volume
- Volumes are "Unity Catalog objects that enable governance over non-tabular datasets". Our app keeps its uploaded files in one.
- PostgreSQL and Lakebase
- PostgreSQL is an open source relational database built for transactional work. Lakebase is Databricks' own managed Postgres service.
Every table has a three-part name
In Unity Catalog, tables and other objects "follow a three-level namespace": a catalog holds schemas, and a schema holds the objects themselves, such as tables, volumes and functions. The names below are made up.
financecatalogbillingschemainvoicestableHere are the same three levels in Catalog Explorer, which you open by clicking Catalog in the sidebar.
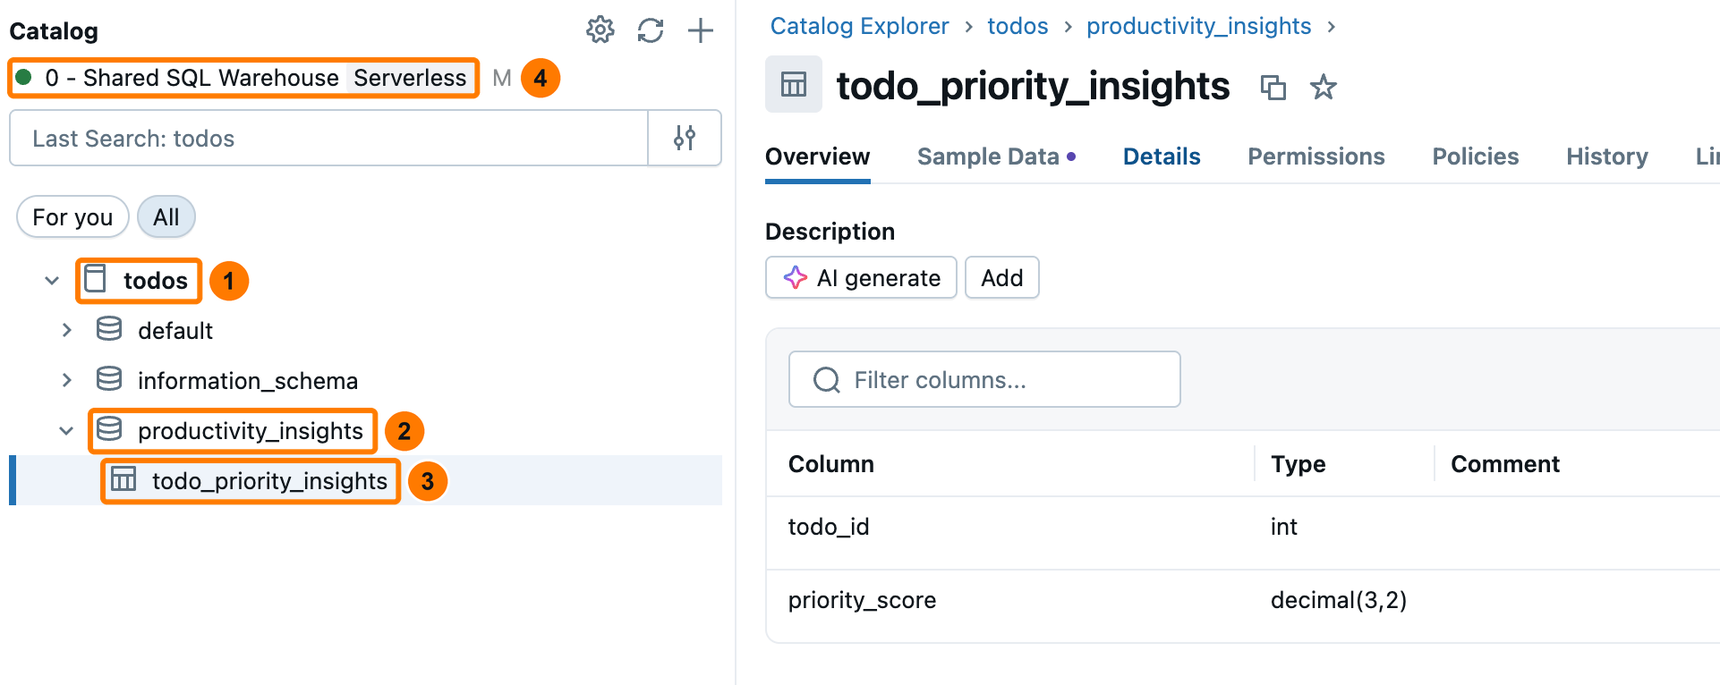
- Catalog:
todos. - Schema:
productivity_insights. - Table:
todo_priority_insights. Its full name istodos.productivity_insights.todo_priority_insights. - SQL warehouse. The table is storage. A warehouse is the compute that reads it.
What a Delta table is on disk, and what changing one row does
A Delta table is a folder. The rows are in Parquet files, a column-oriented file format. Next to them, a _delta_log folder holds one numbered JSON file for each committed change, as the Delta protocol describes. Databricks keeps that table history for 30 days by default.
invoices/_delta_log/the log00000000000000000000.jsonfirst commit00000000000000000001.jsonsecond commitpart-0001.parquetrowspart-0002.parquetrowsplus one new entry in the log
Databricks states it plainly: "Without deletion vectors, modifying a single row requires rewriting the entire Parquet file containing that record." With deletion vectors, the row is marked as modified in metadata instead and readers apply that mark at query time. Either way, the design favours reading many rows at once over changing one. The rest of this post is what that looked like in a real application.
03 One save, two databases
Here is one save drawn to scale. Both lanes start the same way: every request first passes through the Databricks Apps proxy, which checks that the user is signed in; that takes about 0.5 s (Observed). On the warehouse the save then sends 13 statements, each waiting for the one before it (Emulator), and each takes about 0.5 s, anywhere from 0.3 to 1 s (Observed). On PostgreSQL the database work is too small to draw as steps. Whole requests take 0.06 to 0.17 s in our local measurements (Observed, local), and the second lane draws the larger figure.
| What we looked at | SQL warehouse over Delta | PostgreSQL |
|---|---|---|
| One small statement | About 0.5 s. In two requests we timed end to end it came to 0.51 and 0.64 s per statement (Observed) | Not timed on the live server yet. Our diagnostics page calls a round trip good at 20 ms or less (Target) |
| A whole request | Opening the list views: 7.7 s for 15 statements. A records query: 15.9 s for 25 statements (Observed, before tuning) | A page of records from a 10,000-row table: 55 ms at the 95th percentile. Metadata requests: 100 to 170 ms (Observed, local, without the proxy) |
| One save | About 60 round trips before tuning (Observed). 13 statements in sequence after it (Emulator): about 7 s with the proxy (Estimate) | Drastically faster on the running app (Observed, not yet timed). Under 1 s with the proxy (Estimate) |
| A good save, by our diagnostics page | 3 s or less (Target) | 0.5 s or less (Target) |
| Answers kept in memory to save round trips | Configuration and permission reads; sign-in and access answers for 30 seconds | None. The app reads everything on every request |
The two Target rows are the thresholds our diagnostics page uses on each database. We had to give the warehouse its own, looser set, or a healthy warehouse would always have read as slow.
None of these statements is a slow query. Each one reads or writes a handful of rows. What differs between the two lanes is the price of a single statement, multiplied by the number of statements the user waits for.
The last row deserves a second look. On the warehouse we kept configuration and permission answers in memory, because every read we avoided saved about half a second. On PostgreSQL we switched all of that off. The app now reads everything from the database on every request, so it sends more statements than it did on the tuned warehouse, and it is still drastically faster.
04 Why an analytics engine is slow at app work
Databases are built for one of two jobs. In Databricks' own explanation of what OLTP is, OLTP focuses on "efficiently and reliably storing and updating transactional data in real time for live operations", while OLAP "combines and groups data so it can be analyzed from different perspectives". A web app that saves records is OLTP work. A SQL warehouse is an OLAP engine.
1. A fixed cost for every statement
A SQL warehouse is a compute resource to query and explore data. In our app, every statement sent to it carried a fixed overhead before it ran, even one that touched a single row: 0.3 to 1 s per statement (Observed). Next to a report that runs for a minute, that overhead is nothing. Next to a save that touches five rows, it is almost all of the time.
The data layout points the same way. AWS explains it in its columnar storage documentation: transactional work reads and writes whole records, so row-wise storage suits it, while analytical queries read a few columns across many rows, so columnar storage suits them.
2. File skipping instead of a row index, and no row locks
PostgreSQL finds a row through an index and can lock it while a transaction changes it: FOR UPDATE locks the selected rows until the transaction ends. Databricks finds a row differently: it uses per-file statistics such as minimum and maximum values to skip files that cannot match, then reads the files that remain.
Concurrency is optimistic. Databricks' ACID guarantees page says "there are no locks on reading or writing against a table"; when two saves change overlapping data, the conflict is found at commit and one of them must retry. The transactions a web app's database driver opens are the interactive kind, and Databricks notes that interactive transactions "can conflict at the table level", apart from plain appends. Primary and foreign keys are informational, so the app has to check them itself.
3. Many statements, one after another
A save is not one statement. It checks who the user is and what they may change, reads the field definitions and rules, writes the record, its history and its audit trail, then commits. Microsoft calls this the chatty I/O antipattern: "The cumulative effect of a large number of I/O requests can have a significant impact on performance and responsiveness."
Before any tuning, a save needed about 60 round trips on the running app (Observed). We followed the antipattern's advice: we cached configuration and permission reads, wrote audit rows in one statement at commit, moved derived work to the background and skipped reads we did not need. In the last round, a save went from 32 statements, 29 of them one after another, to 18 statements, 13 one after another (Emulator).
SELECT queries, but it is read-only. A save still needs a different kind of database.
05 What the app had to build around Delta
Speed was the problem people could see. Underneath it, the app kept needing things a transactional database gives for free. Each row below is something we built, limited or accepted while the app ran on Delta (Observed in our project), next to what PostgreSQL does.
| What the app needs | On Delta through a SQL warehouse | On PostgreSQL |
|---|---|---|
| Keys that hold | Keys are informational, so the app checks them itself. Deleting a parent row leaves its child rows behind unless the app removes them | The database enforces primary and foreign keys |
| Two people saving at once | No row locks. The save that loses the race at commit is run again, or the user is told the app is busy | Row locks: the second save waits its turn |
| A commit that is refused | The transaction stays open and aborted until it is rolled back. A pooled connection left that way broke the next request until our database layer learned to roll it back or replace it | After a failed commit the connection was ready for the next request (Observed) |
| Undoing part of a batch | Databricks' ROLLBACK undoes the whole transaction and we had no savepoints, so a bulk save handles one record at a time | Savepoints: one record in a batch can be rolled back on its own |
| Many writes in one transaction | Databricks allows up to 100 intermediate commits per table in one transaction, and every copied record writes to the same shared tables. Copying a record with 120 related records failed, so that feature is limited to 40 | The same feature copies up to 1,000 |
| Reading configuration | Kept in memory and carefully invalidated, because each read was a round trip | No cache: read on every request |
| The app's SQL | Written for PostgreSQL and translated, statement by statement, into the warehouse's SQL | Runs as it was written |
| Schema changes | In our deployment the app could not alter tables, so each release's table changes ran from notebooks and each new table needed its own grant | One schema file, applied in one transaction before the release |
None of this is a flaw in Delta. It is what an analytics table format looks like when a web application leans on it. Every row above was code we wrote, tested and maintained only because of where the data lived.
06 The move to PostgreSQL
The fix was to give each kind of work the engine built for it. The app's records now live in PostgreSQL, where a small statement is cheap. Delta stays the home of analytics: pipelines and gold tables remain there. The app is still a Databricks App behind the same proxy, and its files are still in a Unity Catalog Volume.
How the move went
A managed server in the same region as the Databricks workspace. The app connects over verified TLS and reads its password from a Databricks secret.
The copy only reads the Delta tables, so we could rehearse it at any time. The Delta tables were never changed: they were the way back.
Delta enforces no foreign keys, so the copy loads every table first, then restores and checks each relationship and reports any row it could not place. In rehearsal it moved 3,382 of 3,382 rows and checked all 395 relationships.
Stop the app and the intake pipeline, copy once more to pick up the last rows, point the app's configuration at PostgreSQL instead of the warehouse, and deploy.
Going back means restoring the earlier configuration and release. Rows saved on PostgreSQL after the switch are not carried back, so check the app before people return to it.
The email intake pipeline used to write new rows straight into Delta. It now sends them to the app's PostgreSQL data instead.
pg_trgm, which matches text by trigram similarity, and btree_gin, which lets common data types share a GIN index. On Azure Database for PostgreSQL an extension has to be added to the allow list before it can be created, and on our server these two were not. The app now checks once and runs without them: search still finds whole words and parts of words, but it no longer forgives small typos.
Why PostgreSQL and not Lakebase
On Databricks, the native choice for this is Lakebase, a fully managed Postgres database integrated into the platform and offered for low-latency apps. It has been generally available on AWS since January 2026, and Databricks announced general availability on Azure Databricks in March 2026.
Generally available does not mean available in every workspace. Lakebase runs in a list of supported regions, and a project is always created in the workspace's own region. Compliance settings matter too: in March 2026 Lakebase covered workspaces with the compliance security profile only for some compliance standards, and others, such as PCI-DSS and HITRUST, were added in August 2026. In the Azure Databricks workspace this app runs in, Lakebase was not available to us when we needed it. So we moved the app's data to Azure Database for PostgreSQL, Microsoft's fully managed PostgreSQL service. Because the app was written for PostgreSQL first, its SQL runs there as it was written.
What changed for the people using it
Nothing about the app changed for its users: the same address, the same sign-in, the same screens. What changed is the wait. On the warehouse a save took about 7 s after tuning (Estimate). On PostgreSQL the app is drastically faster (Observed). We have not yet timed individual requests on the live server, so the "under 1 s" in this post stays an Estimate until we do.
07 Choose the database before you build
Pick the database by the work the app does, before any code depends on it: count the statements a click sends, price one statement, and keep app records and analytics on separate engines.
For your three busiest actions, list every statement they send. If a save sends more than a handful, the app needs a transactional database.
Time one small read and one small write on each candidate database, then multiply by the number of statements a user waits for.
App records in a transactional database; analytics in Delta. If reports need the app's records, copy them into Delta rather than pointing the app at Delta.
Lakebase is the native choice on Databricks, and a Lakebase database can be added to an app as a resource. Before you design around it, check that your workspace's region is on the supported list and that you can create a project in your own workspace.
Put it in the same region as the app and pool connections. Azure Database for PostgreSQL has a built-in PgBouncer connection pooler on its General Purpose and Memory Optimized tiers (not on Burstable).
Batching writes helped on the warehouse and still helps on PostgreSQL. The read caches we built for the warehouse turned out to be unnecessary there.
08 Frequently Asked Questions
09 Abbreviations & Glossary
pg_trgm and btree_gin extensions.