Web based applications are dominating the software industry and various frameworks like Angular 2, React, polymer and Lightning are on rise. From movie Spider man, this dialogue stands very true – With great power comes great responsibility.
As a web developer, its our job to make sure the application implemented by us, stands on performance benchmark and at the same time development time is reduced. To achieve this, fast and effective troubleshooting of web application becomes integral part of project development. One of the best tool to troubleshoot web applications are available freely – Google chrome developer tools.
In this blog post, we will uncover lots of tips and tricks about using chrome developer tools.
To launch, chrome developer tools in chrome, use shortcut ctrl+shift+I or ctrl+shift+J. We can directly execute Javascript in chrome dev tools without creating any html or javascript file.
Console API
we will start with console API of chrome developer tool first.
Printing Debug statements in Javascript
we can use various methods of console in javascript to debug our code. Previously, if we wanted to debug JavaScript, alert methods were mostly used however they were very annoying. Below code snippet shows available methods to print debug statements in chrome console.
<script>
	console.error('Google chrome dev tools - error');
	console.warn('Google chrome dev tools - warn');
	console.info('Google chrome dev tools - info');
	console.debug('Google chrome dev tools - debug');
	console.log('Google chrome dev tools - log');
</script>
Below is output, how its displayed in chrome
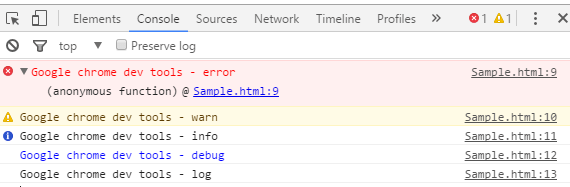
As shown in above image, different log levels of console method printed in different color. error log level even prints complete stack trace of methods showing origin of error.
Assert statements
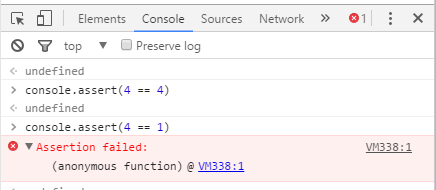
If you are coming from Java, .net or Salesforce background, you already know importance of assertion. Luckily in chrome dev tools as well, we can use assert statement to make sure expectation of code is properly met. If assertion is true then nothing happens, however if its not true then prints stack trace of error as shown in image below
Grouping console log statements
In situation, where we need to print lots of debug statements however it may be cumbersome to find intended statements in a heap of logs. Assume that we have multiple components in a page, wouldn’t it be nice, if some how we can group debug statements per components?console.group() method helps us to achieve this. We can give a name of group and then close it using console.groupEnd() . Group of these debug statements can be expanded or collpased in console view. Below code snippet shows how to use it
<script>
console.group('Point and Click');
console.log('Learn basics of CRM');
console.log('Learn Workflow, process builder');
console.log('Learn Approval Process');
console.log('Learn Reporting');
console.groupEnd();

console.group('Coding');
console.log('Understand OOPs');
console.log('Learn Apex');
console.log('Learn Trigger');
console.log('Learn HTML, Javascript');
console.log('Learn Lightning Components');
console.groupEnd();
</script>

Printing object using console.dir
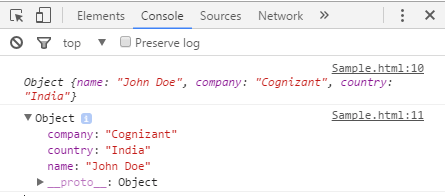
We can print object in console using console.log, however it will print in string format. There is one utility method console.dir, specially to print object in directory structure. It makes object more readable.
Example:
<script>
var person = { name : 'John Doe', company : 'Cognizant', country : 'India'  };
console.log(person);
console.dir(person);
</script>
Output:
Calculate time taken to execute code
We can use console.time to calculate time taken by some piece of code. Time label needs to be supplied in console.time and console.timeEnd.
Example :
<script>
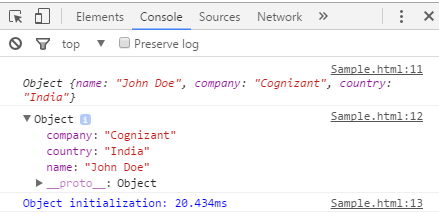
console.time('Object initialization');
var person = { name : 'John Doe', company : 'Cognizant', country : 'India' };
console.log(person);
console.dir(person);
console.timeEnd('Object initialization');
</script>
Output:
Formatting console.log
Console logging methods can also be formatted using %s for string, %i for integers, just like printf method of C language.
Example :
<script>
var apiV = 36;
var tech = 'Apex';
console.log('%s is running on version %i',tech,apiV);
</script>

Output : Apex is running on version 36
We can also use %c, to apply css style on console log statements as discussed in this article.
Clear method
If there are lots of information available on console and we want to rid off it, then clear() method can be executed on console to clean console panel.
Console.table
This command can be used to display list of any object in tabular format. Consider below array of object in JavaScript code
<script>
var persons = [
{ name : 'Marthas', company : 'Cognizant', country : 'USA' },
{ name : 'John Doe', company : 'Cognizant', country : 'India' },
];
</script>
Below image shows two outputs. one using simple console.info method and other using table method.

Command line API
Next, talk about Command line API supported by chrome developer tool. Using Command line API, we can execute JavaScript in context of current page or monitor events. We can execute any method declared on web page or check variable values.
Selectors
There are basically three types of selectors available to use in chrome dev tools, its syntax might look familiar to you if you have used JQuery in past. We can use element Id, class or tag names to select elements, all CSS selectors will work.
- $(Selection)
- $$(Selection)
- $x(xpath)
Consider below html example

We can use selectors, as shown in below gif image

Inspect
We can combine selector and inspect method together to inspect any element in web page as shown in below image

Monitor events
We can monitor any supported events in chrome using monitorEvents methods. Let’s assume, we need to monitor click event on first p tag in document. Below image shows, output when we click on first paragraph element in web page. monitorEvents takes first parameter as selector and other parameters as event types to be monitored.

Leave a Reply